Traders use technical indicators to find trade entries in the market. Are there any technical tools to help our psychology? Today I want to share with you a strategy that uses indicators to manage your emotions effectively.
Before we dive into it, I want to remind you that success in trading depends a lot on a positive mindset. A positive mindset helps us to match our expectations with the realities of trading.
What can expectations about the market do to us?
Let me give you two examples of trades that can dramatically affect our mindset. Here are two cases – being shaken out from a profitable trade and missing the profit target:
1. Too small a protective stop. Have you ever found yourself finding a great setup, setting your target but using too small a stop? You did almost everything right, but the volatility was too big to tolerate keeping you in the market with your small stop. Eventually, you get stopped out, and the market immediately goes to your target afterward.

2. Too big of a profit target. Similarly, you found your setup, defined the risk by setting your stop and set your target. What happens next is you ride the market almost to your price target and a few ticks before the target market turns around and goes back, eventually turning the trade into a loss.
Try to reflect, how would these scenarios affect your emotions and thoughts?
After several weeks of experiencing these kinds of trades, the majority of new traders feel like the market is after them. They think the market is rigged. While the reality is that the market doesn’t even know they exist!
What happened here? The expectations of the new traders didn’t align with the reality of trading. Eventually, it produced an emotional grudge that shadows their judgment, confidence, and attitude.
How to deal with it professionally?
Professional traders know the kind of things that can happen in the markets. Let me be clear here, they don’t know what’s going to happen, but they expect the kinds of scenarios that may occur! When you accept the chance of something sudden or different to happen, you’re not surprised much anymore if unpleasant things occur in the market. It makes your emotions tame, and it keeps you in the game.
What are the tools?
Every trading platform has some technical tools available to help us to align our expectations with the realities of trading to achieve the best results. Let’s look at them.
Volume

The volume can tell us a lot about the character of the market. If we see that the daily Volume is lower than average at this particular time, the market might be waiting for something or preparing to move. From here, we can conclude that the volatility may be limited at the moment, and we shouldn’t expect big moves from the market.
If Volume is higher than the average, we can expect higher volatility in the market. So, it would be more appropriate to set our profit targets further and try to enter a trade catching the momentum.
Average True Range (ATR)
ATR helps us to quantify how much the market moved on average over a specific time period. Let’s look at two ways of how it can help us to align our expectations about the market better.
Defining the price targets

ATR gives us objective evidence of whether it’s reasonable for the market to go to a certain target or not. For example, if you trade intraday, you can measure the current daily range and subtract it from the ATR reading. The result would be a potential move you can expect today.
If the number exceeds or equal to the distance to your target from the point of entry, your target is reasonable. On the contrary, if the difference between the current daily range and ATR is smaller than the distance to your target from the price you want to enter, you may want to reevaluate what to expect from the move or whether to take the position at all.
Estimating the risk
You can also use ATR to set your protective stop at a reasonable distance from the entry. Again, let’s say you’re considering taking an intraday position. You can apply ATR to a lower timeframe like 30m, 1h, etc.
The reading of ATR at the lower time frame gives you a clue of how far your stop should be from the entry. For example, if ATR shows 0.0009 on 1h timeframe, it means that it’s better to set your stop at a distance beyond nine pips to give your position a chance to withstand the ordinary volatility.
How to analyze the ATR and Volume in context?
What if the ATR shows a small reading implying low volatility while the Volume is higher than average? What should our expectations be?
In this case, it would be a good idea to follow the same principle of setting the protective stops, as we discussed before. However, regarding the profit targets, as the Volume is high, we still can expect a significant move, way beyond the ATR readings. Why is that?
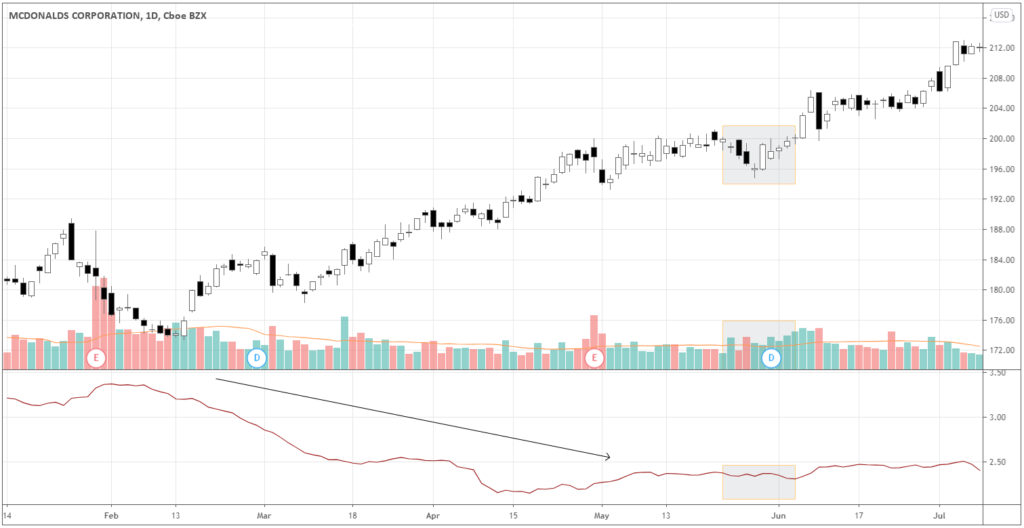
Look at the chart of MCD below. During the period, that’s marked in grey, the Volume had been higher than the average (volume bars are above the MA – the orange line), while the ATR remained low compared to February and March. Later on, the breakout occurred as the Volume kept increasing, pushing the price further up.
Such a situation occurs when there is new important information available, but the market participants can’t agree with each other, whether it’s good for the asset or not. Therefore, a significant number of participants keeps opening positions in the direction they think is right, absorbing the positions of other participants with contrary opinions.

When one of the sides orders’ Volume overweighs another, breakout happens, and the volatility increases dramatically. This splash in volatility won’t be reflected on ATR right away, because ATR calculates the data from the past. Still, over time you’ll see ATR rising, especially if the breakout developed into the trend.
Summing up
A positive mindset and the right expectations about the market are the crucial elements of successful traders. Traders can use technical indicators like Volume and ATR to align their expectations about the market better. Notice, we don’t use these indicators to get the feeling of being right about the market by picking tops or bottoms, but to get an objective view of what is “normal” in certain market conditions.


