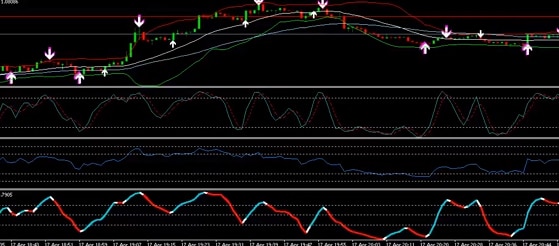
A repainting indicator is an indicator that changes its historical values (candles left from the current candle). Speaking in other words it is changing its value after the candle is closed (it is OK if the indicator value is changing when the candle is forming). Generally, it is a cheat indicator that looks great on the back-test but it cannot be used for live trading. In most cases, it calculates future data (candles to the right) to show more accurate values or entry signals. In the real-time world, we do not know what will be the open, close high and low price of the future candle, so the indicator that using these data is a fake indicator with no real use.
These types of indicators are widely used by the scammers. Many of them try to sell you them, they are showing you amazing back-testing results. Well, I would never recommend you to purchase the indicator (or trading system) only because you someone show you the chart image or great back-testing results. So, to avoid being scammed it is good to know how you can check if the indicator is repainting.
The best way to do so is by using MetaTrader’s Strategy Tester tool. Select the indicator, the one you want to check. When you open the tool, ensure that the model parameter is set to “Every tick” value. You can select any trading instrument and keep default indicator parameters. Though any time-frame would work, I recommend you to use a smaller one because it will fasten the test. The visual mode must be checked. Now, you are ready to start the test. If you do so you will see the indicator running in the chart. Check the indicator, if the values or signals change after the candle was formed it means that the indicator is repainting.
However, if the indicator keeps its value after the candle is formed it does not mean that it not repainting. To be sure, you have to perform a further test. Continue running the in indicator the strategy tester and let it finish. Now open another chart for the same trading instrument, using the same time frame and the same time period. Check these two charts and the indicator has to look exactly the same on both charts. If this is true, the indicator is non-repainting.
So, are the all repainting indicators fake? Well, there are not. Actually, some of them can be very useful. It depends on how its values are calculated. It must not use future values. If it, not a case indicator can still repaint but it can be useful. Some useful repainting indicators are using a higher time-frame candle values, those values might change until the higher time frame chart candle is not closed. Other types of useful repainting indicators are the ones that are looking for high and low levels. Basically, if the creator of the repainting indicator does not mention that the indicator is repainting (he may avoid word repaints by saying the signal may appear, disappear or reappear) and does not explain why it repaints and how you should use it, the indicator is a scam.
Good examples of useful repainting indicators are fractals and zig-zag. They are widely used and are offered in the standard MetaTrader platform. Fractals are the indicator developed by Bill Williams. It shows highs and lows for every five candles in a row. Commonly they are used for determining stop-loss levels, they can also define breakout, entry, support and resistance levels. Zig-zag is a repainting indicator that shows the points in the chart where the price reverses. It points highs, lows swings, and waves. So, it is helping us to recognize graphical chart patterns.
Can we stop the indicator being repainting or make a non-repainting from the repainting one? Well, yes we can but the only way to do so is by changing its code. Also, a non-repainting version of the repainting indicator will vanish some of its characteristics. So, for sure the creation of a non-repainting version will not be useful and the newly created indicator will not have the desired accuracy.
Therefore, the repainting indicators change the values upon the closed candles. The majority of them cannot be used for live trading. However, some of them like fractals or zig-zag can be very useful. The proper check to determine whether the indicator is repainting can be performed through MetaTrader’s Strategy Editor tool.


