One must keep in mind that global trade consists of many aspects, all of which are intertwined. Participants in each of the global markets are trying to profit while hedging at the same time. That causes correlations -the relationship between the price movements of currency pairs and other markets.
From a statistical perspective, correlations happen when two variables behave in a manner that suggests interdependence. Primarily, forex trading is about forecasting and explaining price movements of currency pairs. But one needs pointers to make successful forecasting. Correlations happen to be one of the most crucial pointers.
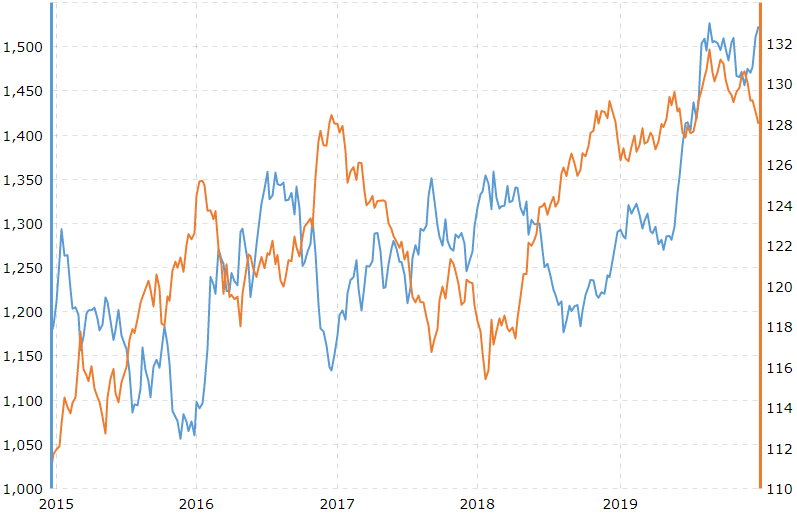
A popular correlation for your consideration is between the gold price and the U.S. dollar value. The world over, the U.S. dollar is the primary currency for pricing and trading gold. However, strengthening often predicts a falling gold price. Although this inverse relationship is not always true, it is persistent and stable most of the time.
Think You’ve Found One? Here are The Questions to Ask Yourself To Check Founded Correlations
The forex market is huge, and traders encounter a deluge of market data they use to find correlations. But the great amount of data is likely to lead to spurious correlations if not carefully analyzed. Before you convince yourself that what you have is a correlation worthy of trading, make sure you have answers to the following questions:
- Are you sure it is no coincidence? An argument you will often see here is that not all correlations seem to be. Faced with huge amounts of market data, your eyes can sometimes pick out spurious correlations. Simply because the value of the U.S. dollar rises at the same time as the consumption of mozzarella cheese does not imply a correlation. There could be other factors at play that are entirely unrelated.
- Is there a third variable influencing the apparent correlation of your variables? Again, this is to ask you to confirm whether the correlation is simply a coincidence or not. This argument aside, there could be some correlations that might seem illogical but are explainable. It is the time that you need to look out for a third variable. Here, we accept that there is no causation between the target variables, but something else is at play.
Could you explain why deaths by drowning in the U.S. correlate with ice cream sales? Supposedly, this is a spurious correlation. But digging deeper uncovers a third variable that brings about this relationship, and it is temperature. High temperatures lead to more people going out, especially to beaches. At the same time, more people tend to buy ice cream because of the scorching temperature. Therefore, you are not entirely spurious for infer higher ice cream sales from increased deaths by drowning.
- Is the correlation sustainable? Serious forex traders know that the future is quite as important as the past in terms of correlations. While correlations exist, they are often unstable and fleeting. This aspect of trading correlations is critical, especially if you tend to hold long positions. Sustainability is reliability, which implies higher chances of earning a good profit from your trading activities. Some correlations might exist for days and then become useless.
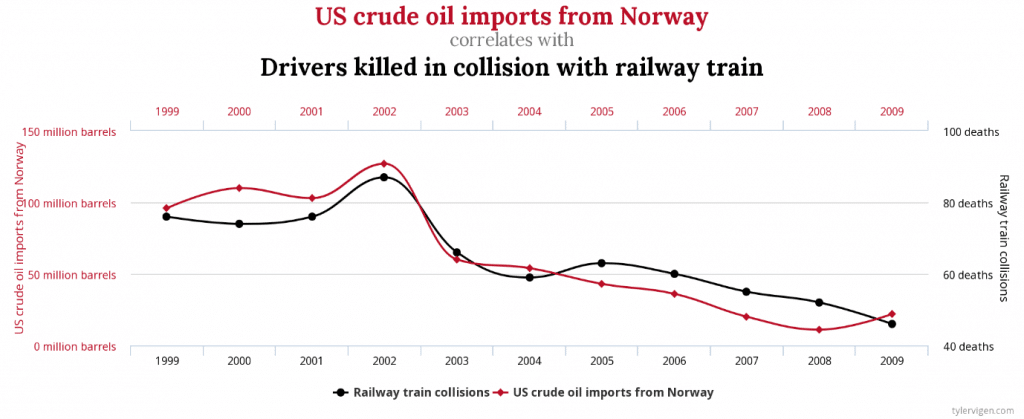
- Can you explain the correlation logically? The world of data could be weird sometimes. Yes, the price of a particular asset might be mirroring the behavior of a certain event, but the question is, does the relationship make an econometric sense? The R2 of the correlation between the number of drivers killed in collision with railway trains in the U.S. and the barrels of crude oil imports by the U.S. from Norway is 99.99%, but is it logical? Therefore, a trader who wants to trade correlations successfully will always want to be sure that there is an actual connection between the price movements in question before confirmation.
Spurious correlations
We have spoken about spurious correlations a lot in the paragraphs above, and you might be wondering what these are. In the simplest sense, spurious correlations are illogical relationships between two variables. It means you can find almost 100% statistical interdependence between the variables, but no actual relationship exists. And there are many.
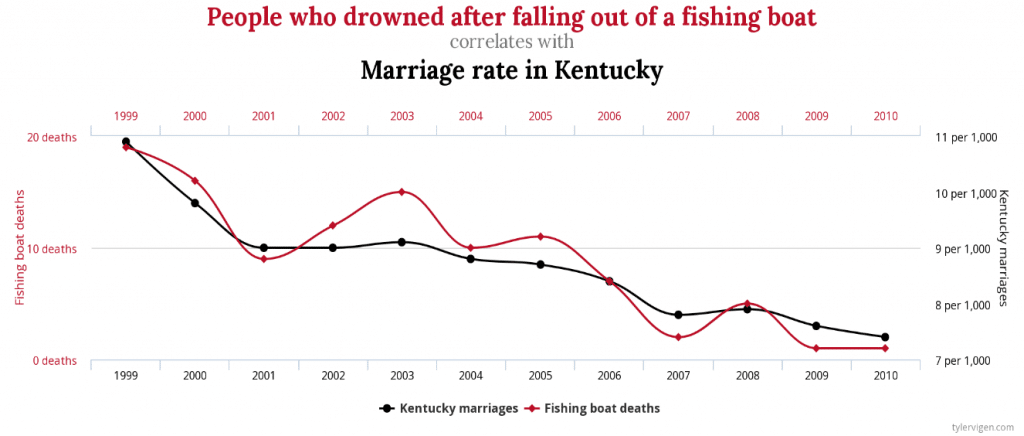
Consider this example. The U.S. recorded a falling number of fishing boat deaths between 1999 and 2010. In 1999, almost 20 people died after falling out of a fishing boat compared to under two people in 2010. At the same time, Kentucky had been witnessing the rate of marriages fall. Quite interestingly, the charts of these two events are almost identical, which suggests a significant statistical relationship, as shown in the figure below.
Another example is what we have already covered i.e., the relationship between crude oil imports from Norway and the number of drivers who died by colliding with railway trains. As it is apparent in the figure below, the charts are almost identical!
The bottom line
Trading correlations is a significant part of many forex trading strategies today. Many investors acknowledge that the global financial markets and other markets are intertwined. As such, a careful analysis of happenings in one market today could give you a good idea of what could happen in another market. But as market data continues to pile, many correlations seem to pop up, and some spurious. Since spurious correlations are likely to mislead you, you had better confirm the substance in any correlation you uncover.


