ForexEzy
No Result
View All Result
  • Top Forex Advisors
    • Best Forex Robots
    • Best Forex Signals
    • Best Managed Accounts
  • Top Forex Brokers
    • Best Forex Brokers
    • US Forex Brokers
    • UK Forex Brokers
    • MT4 Forex Brokers
    • MT5 Forex Brokers
    • Zero Spread Brokers
    • Best PayPal Brokers
    • TradingView Brokers
    • Social Trading Platforms
  • Top Review Platforms
  • Forex Education
    • Getting Started
    • Forex Basics
    • Forex Trading Strategies
    • Money Management
    • Risk Management
    • Technical Analysis
    • Fundamental Analysis
    • Trading Psychology
    • Social Trading
    • Automated Trading
  • Forex Tools
    • Forex Robots
    • Forex Indicators
    • Forex Signals
    • Forex VPS
  • Forex Forecast
  • Crypto
    • Best Crypto Exchanges
    • Best Crypto Bots
    • Crypto Guides & Forecasts
No Result
View All Result
ForexEzy
No Result
View All Result
The World’s Leading Social Trading Platform
Try now
Home Forex Education Forex Basics

Pullbacks vs Reversals In Forex: How To Differentiate Between The Two?

by Chintan Patel
June 7, 2022
in Forex Basics
0
Pullbacks vs Reversals In Forex: How To Differentiate Between The Two?
0
SHARES
11
VIEWS
Share on FacebookShare on Twitter
The Best Forex Robots Report Is Already Here!
best forex robots
Check out 30+ best expert advisors with daily updated live results and statistics
Click Here

Overview

Have you ever closed your positions in fear of a sustained pullback, only to see the market eventually move in your direction and break a new high or low? Frustrating, right? This scenario happens to virtually every forex trader. 

Every trend consists of a series of indefinite, non-linear retracements and reversals as price moves in waves. Ultimately, your performance and analytical skills should improve when you can better distinguish between the two.

What is a pullback?

A pullback (or a retracement/correction) is a temporary price dip or reversal occurring within a larger prevailing trend. Corrections don’t represent a substantial change in the predominant direction of the market.

So, if the price has generally been moving up, the consensus will remain bullish, despite the minor corrections in between. Generally, the simplest way of analyzing pullbacks is by looking at the structure of highs and lows.

The price should continuously make higher highs and higher lows in an uptrend (and vice versa for a downtrend). Once the market suddenly changes this formation, it’s an early sign of a reversal or a deeper pullback.

The chart below shows an archetypal uptrend on the 4HR chart of CHFJPY. We have marked with arrows the retracements and labeled the higher highs (HH) and higher lows (HL), accordingly. 

A 4HR TradingView CHFJPY chart showing the highs/lows of a typical uptrend

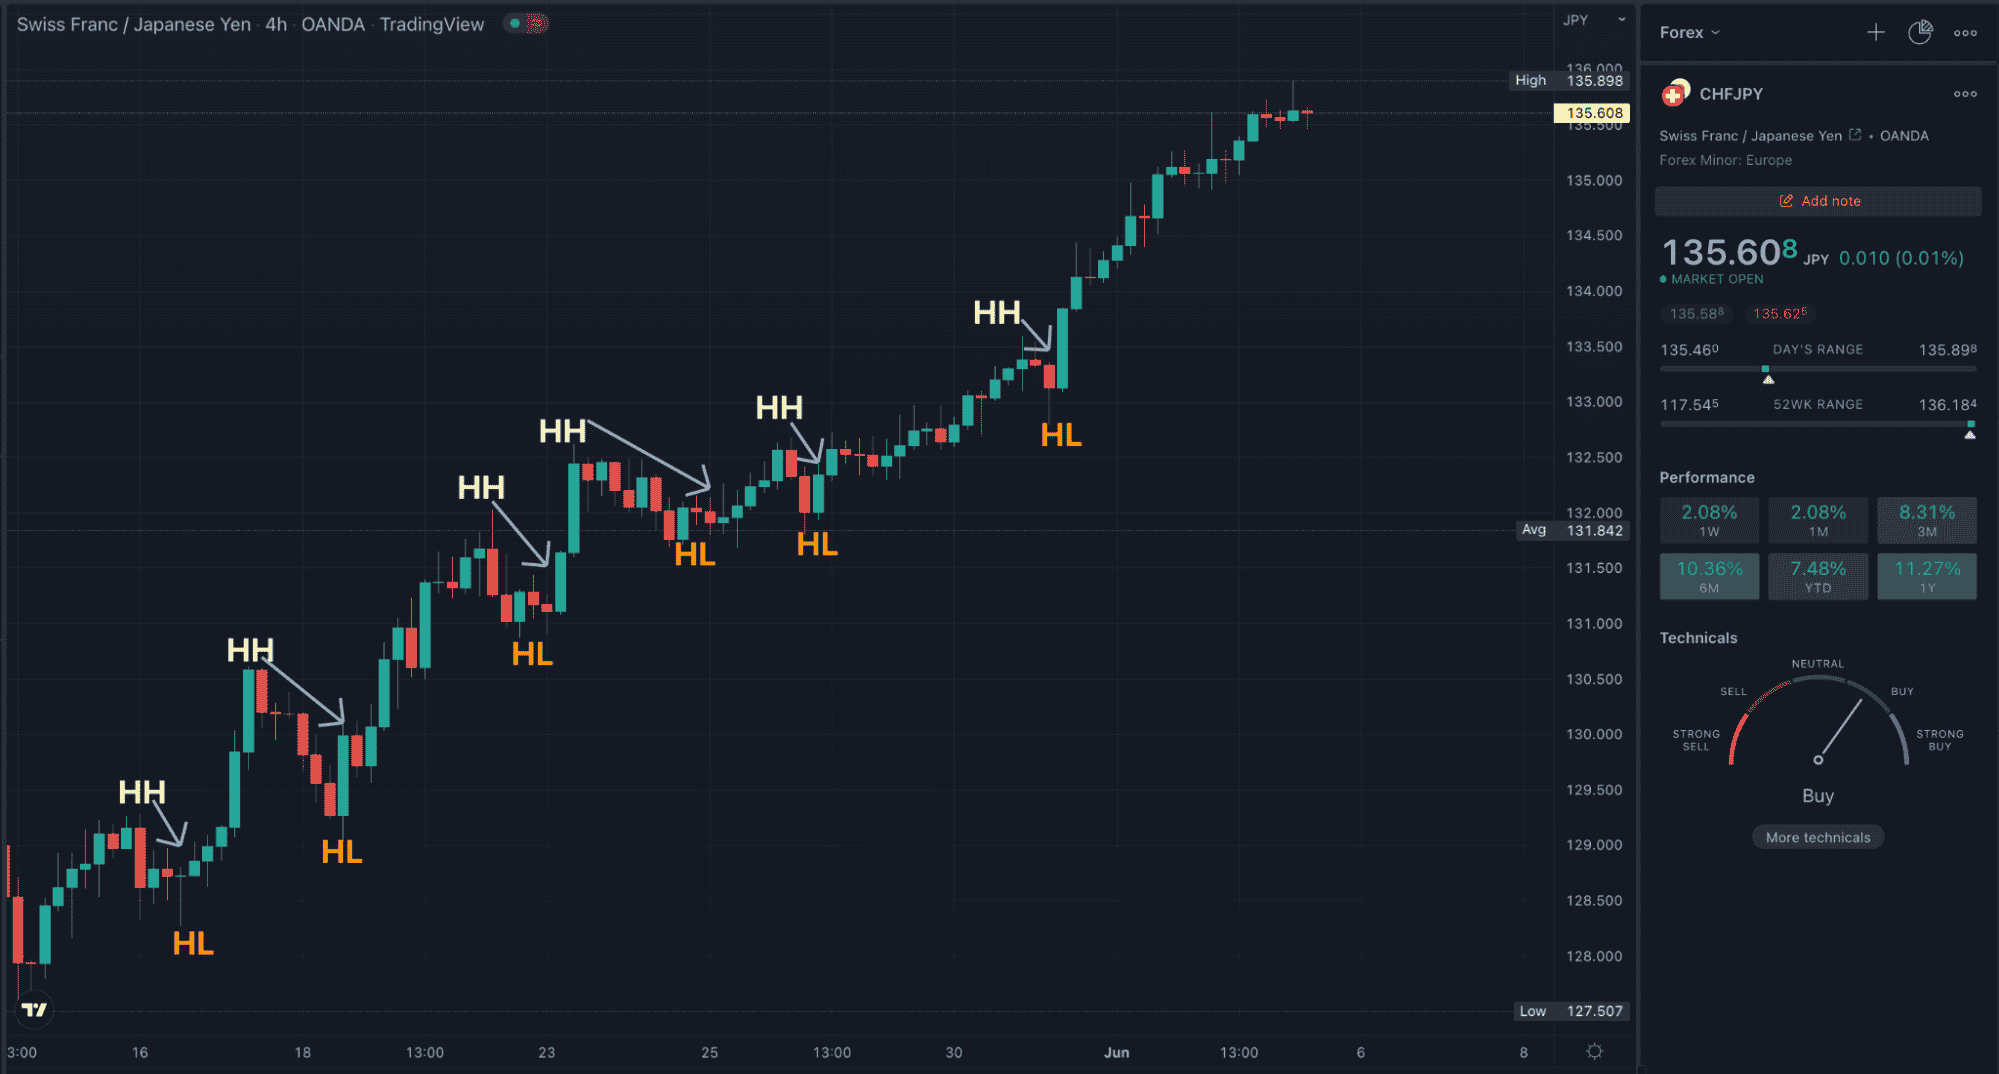
There are several reasons for a retracement. When people exit their positions due to taking profits, it causes the price to dip as orders are effectively being removed. 

The more prominent reason is down to market sentiment driven by a range of technical and fundamental factors. When you’re studying a chart, you’re examining points at which a large group of traders will place more buy/sell orders according to what they believe about a pair’s future.

What is a reversal?

When a pullback becomes more than a mere ‘market hiccup,’ you have a reversal on your hands. This is when a trend completely changes direction for a sustained period. So, a previous downtrend becomes an uptrend, or a prior uptrend becomes a downtrend.

The chart below of USDCAD on the 4HR time is a classic example of this complete shift in sentiment. We see a nice uptrend which was eventually followed by an aggressive downtrend.

A 4HR TradingView USDCAD chart showing a reversal in an uptrend

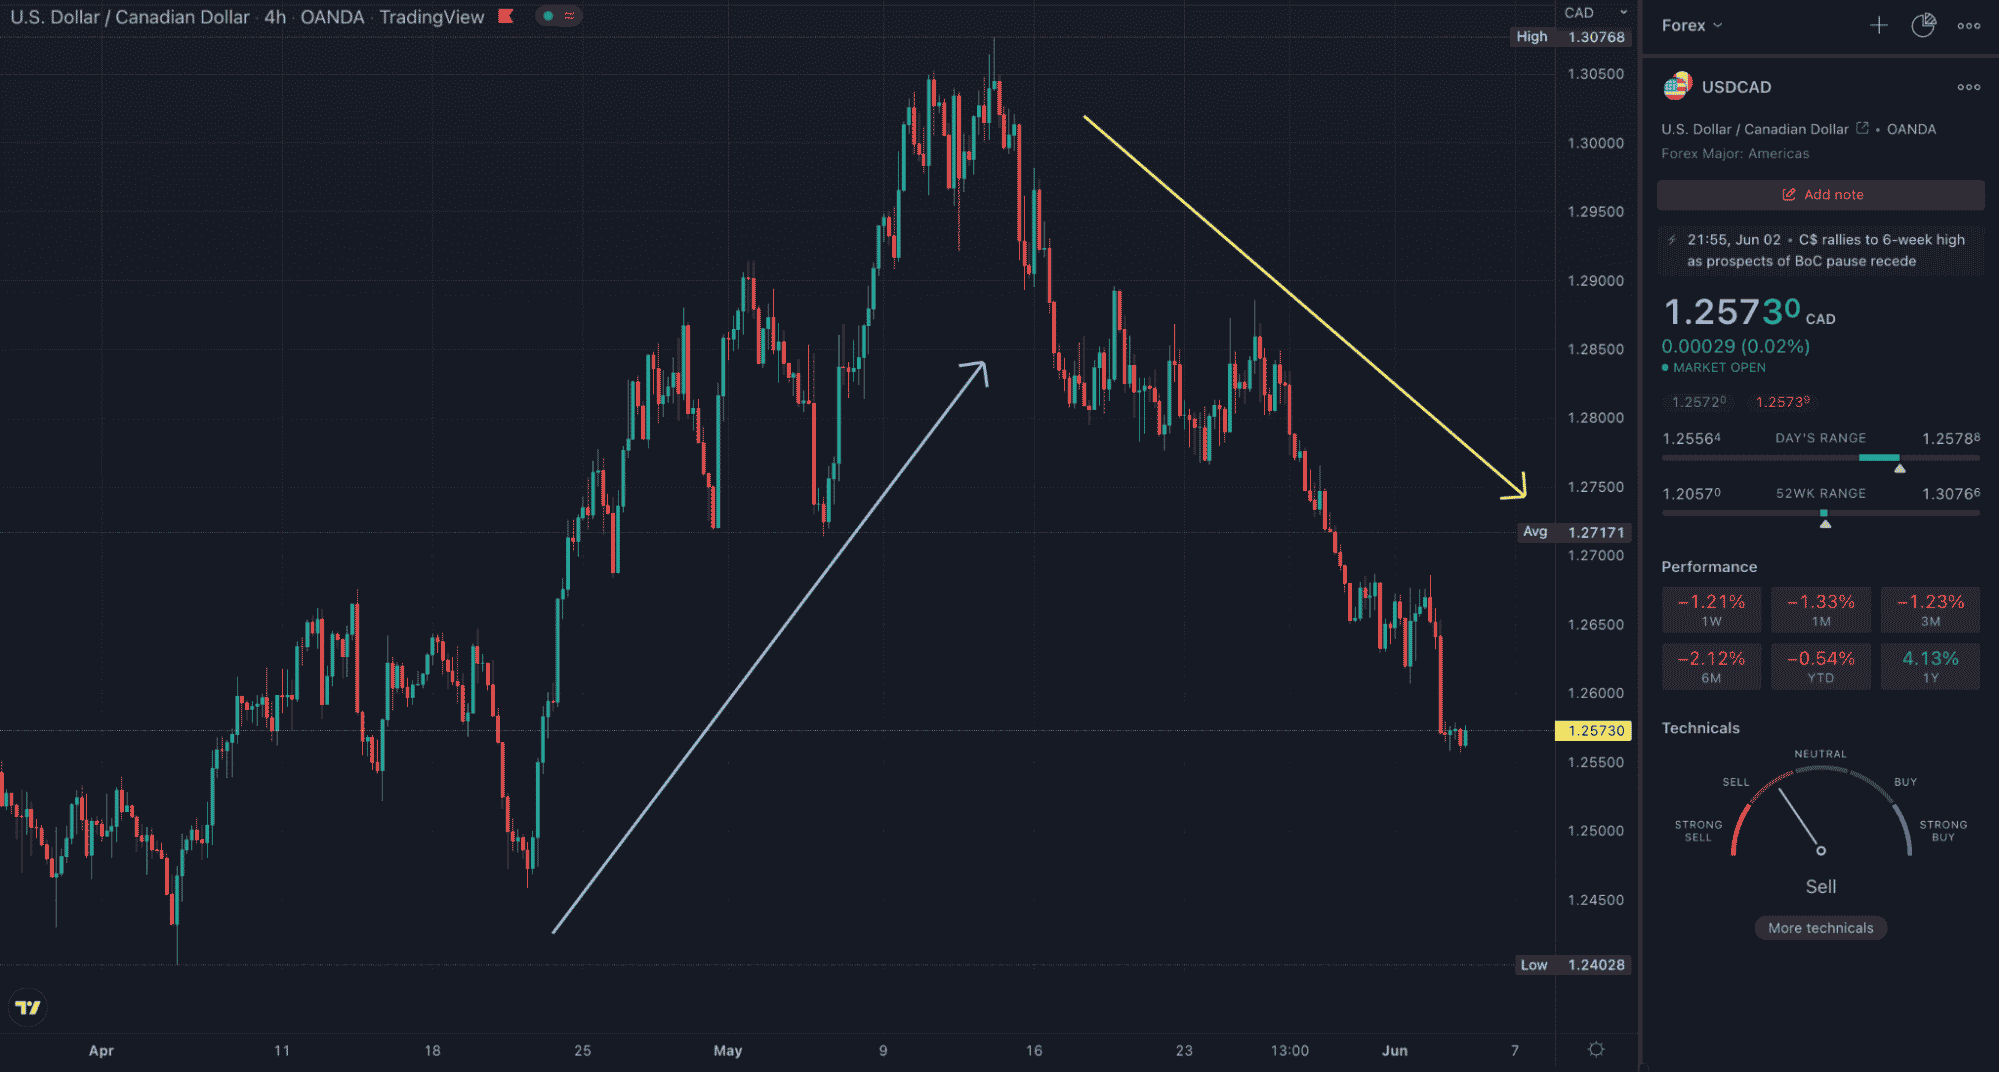
So, what causes a reversal? Similar to what originates a retracement, this answer is multifaceted. A reversal happens when the overall sentiment has changed due to several technical patterns and/or new economic developments.

Differentiating between pullbacks and reversals

Now comes the tricky part. Sadly, it’s impossible to consistently tell whether a market is correcting itself or reversing (after all, there is no holy grail).

This is why knowledgeable analysts approach trading probabilistically. Nonetheless, several well-known techniques help you to better spot the difference and anticipate future movements.

Trend lines

Using trend lines is the bread-and-butter approach in this regard. These essentially act as ‘dynamic’ support and resistance when a market enters into a pullback.

A 1HR TradingView EURGBP chart showing a trend line break

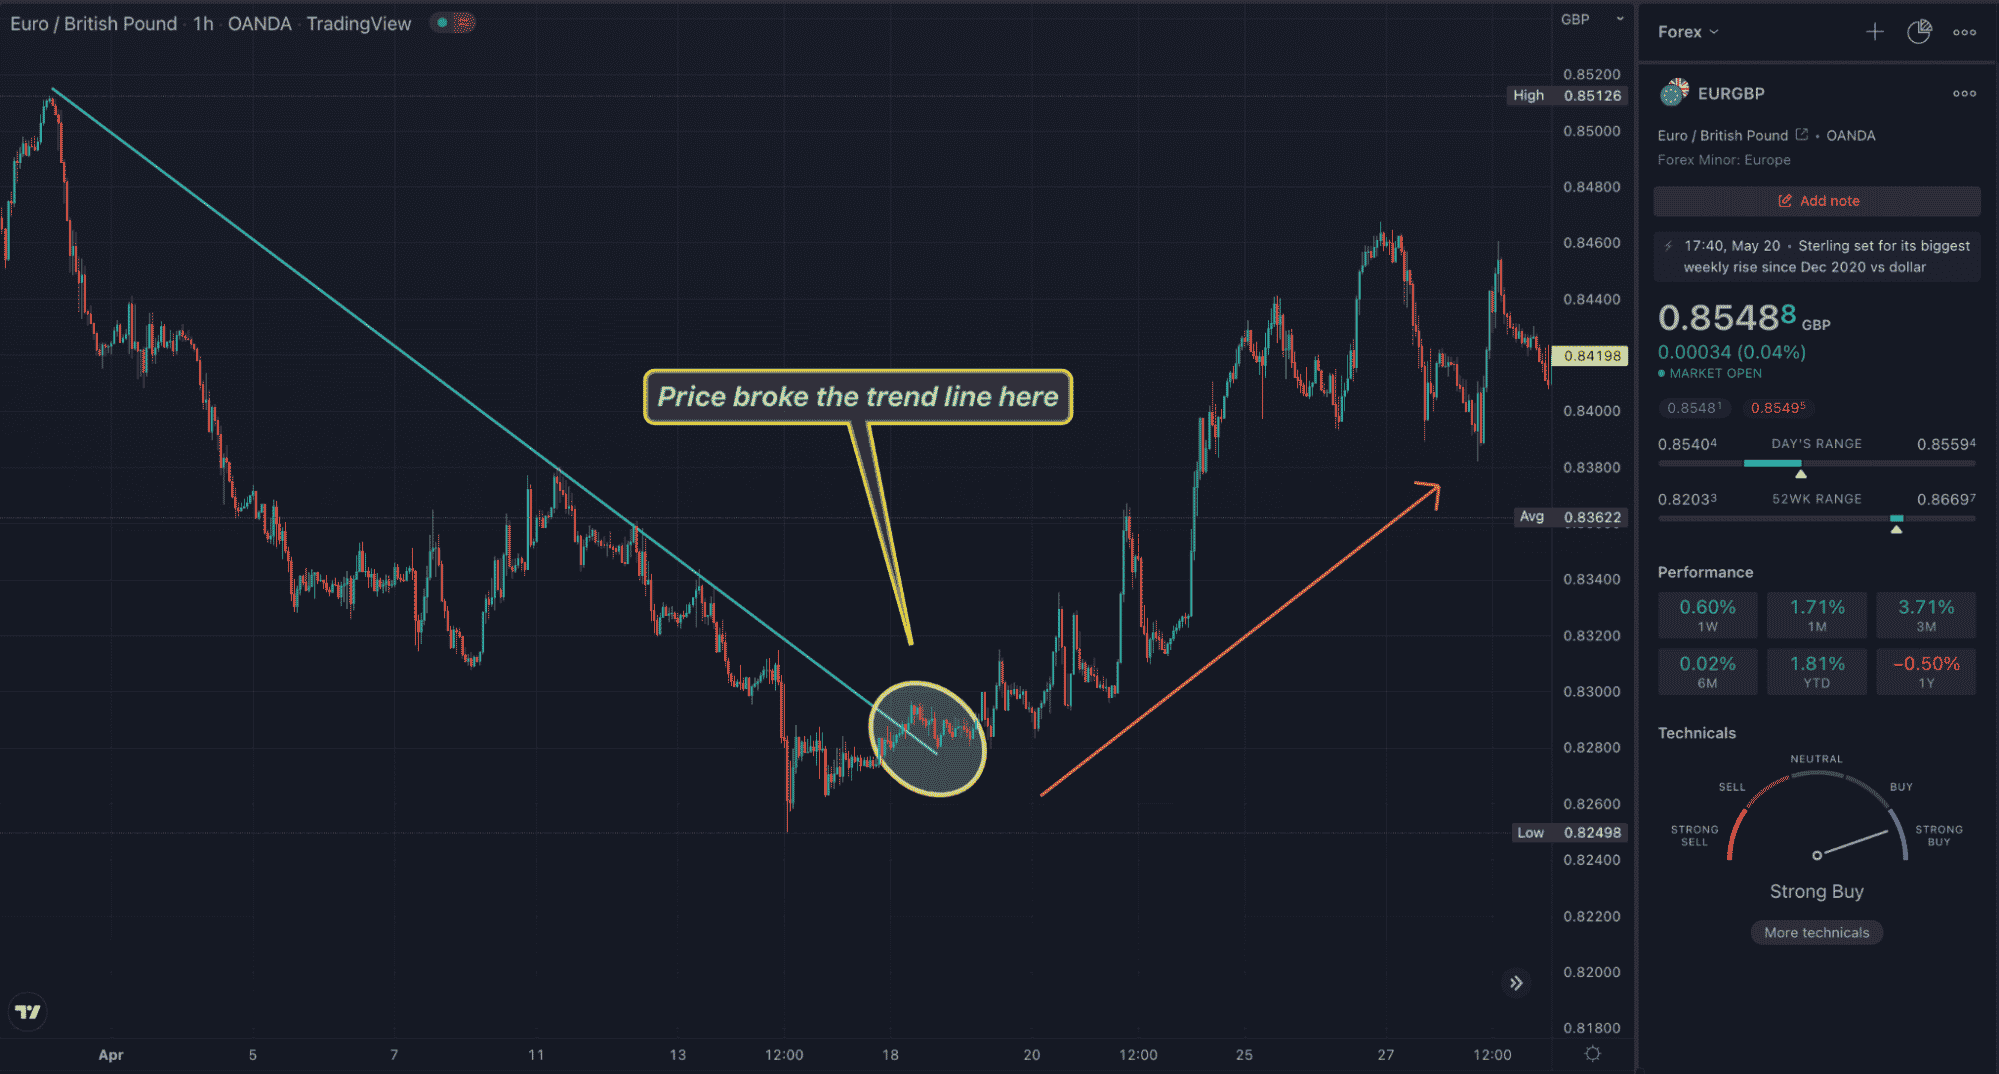
A break of the trend line is usually an early warning of a pending reversal. Yet, this technique isn’t always particularly reliable depending on your time frame reference, the larger price structure, etc. Plus, the method of drawing trend lines is subjective, meaning you certainly shouldn’t rely on this approach alone.

Support and resistance

You can use simple support and resistance zones with trend lines, price action, and even moving averages. When support is created, it’s usually from a substantial retracement that violates the trend line. However, this may not necessarily be a reversal since the price may still test the starting point again.

In the example below of EURCAD’s 4HR time chart, we see a decent downtrend. One leg of this move broke the trend line (in blue); however, the price came back to the previous low. Afterward, the next move broke the second trend line (in yellow).

A 4HR TradingView EURCAD chart showing a reversal with support and resistance

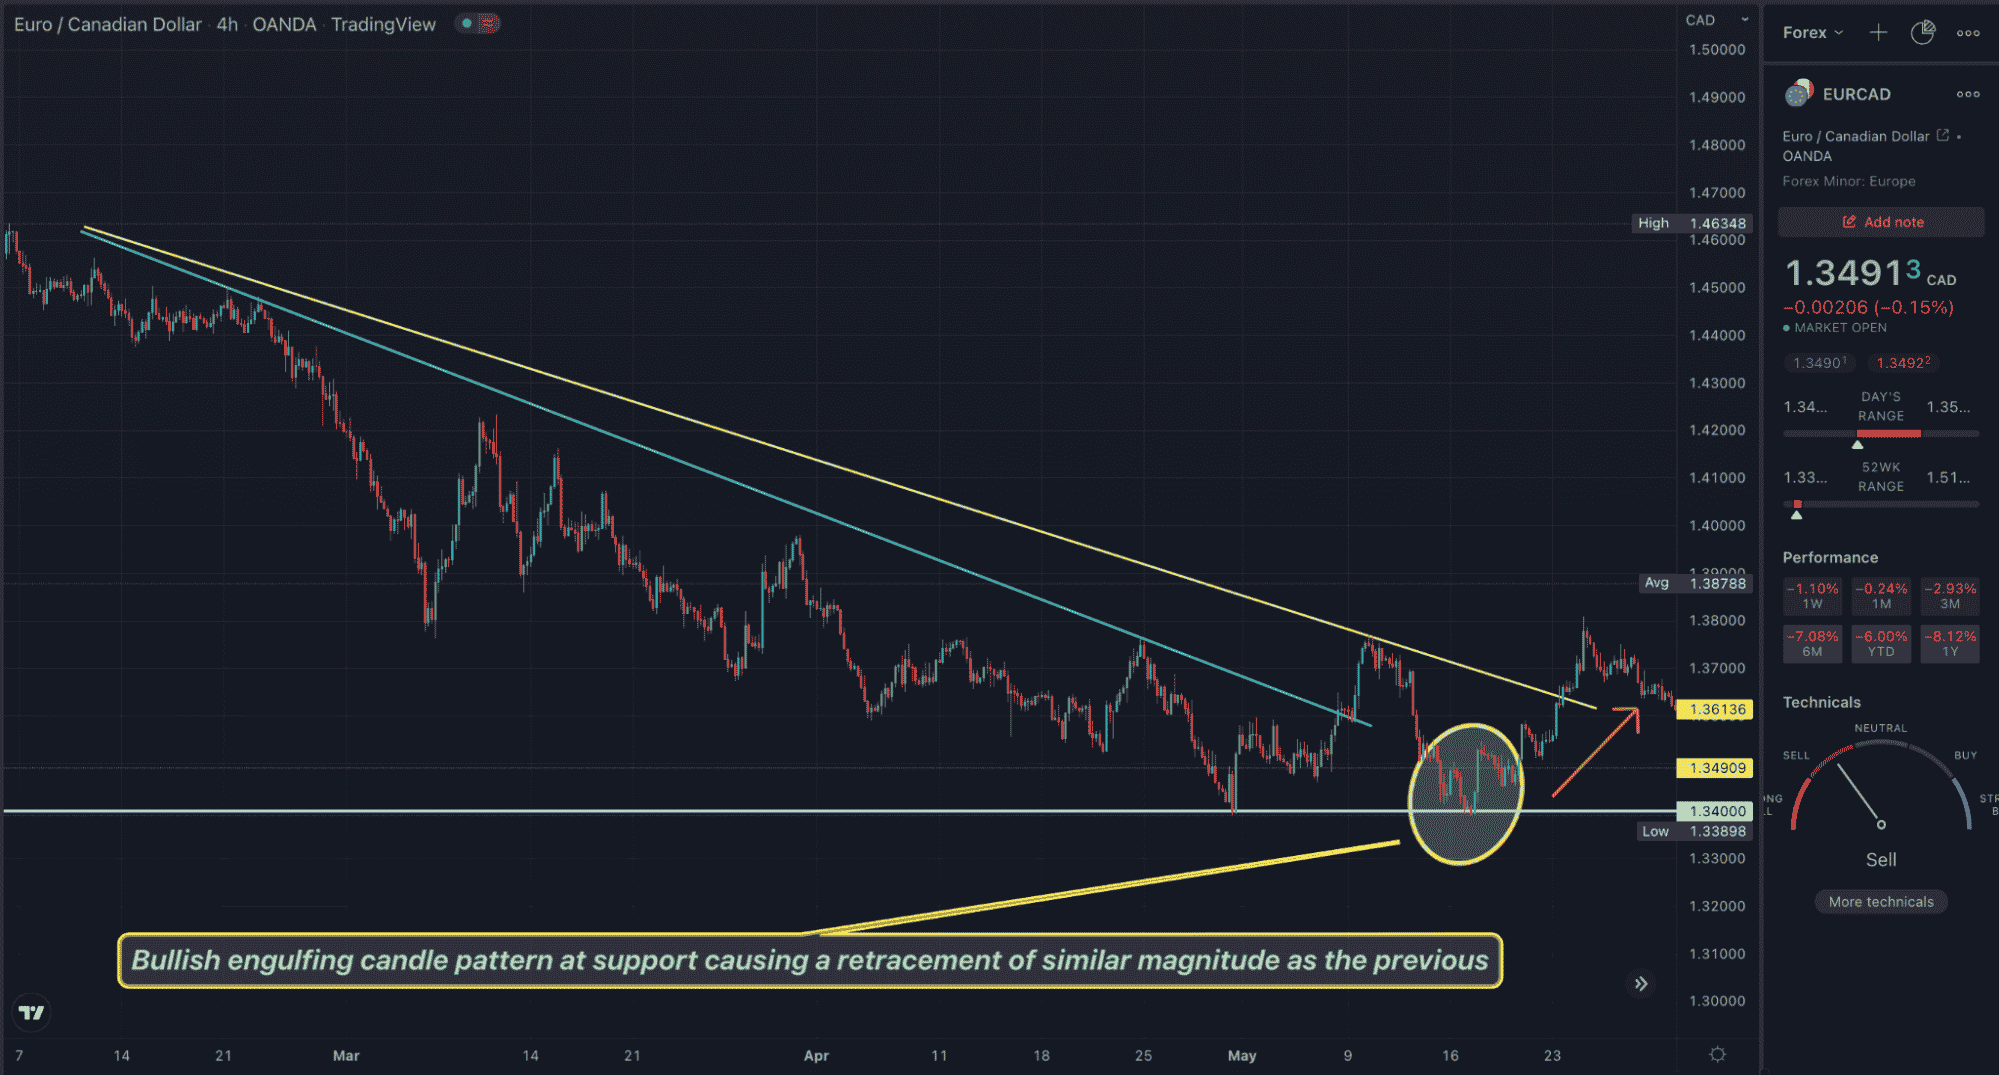
Based on this activity, traders would regard this as a key support zone in the future. Analysts use support and resistance in combination with a variety of price action formations (engulfing candles, pin bars, etc.) and other patterns like double tops, head-and-shoulders, etc.

As a tip, because reversals take a long time to happen, you should always draw your support and resistance from the 4HR chart (or higher) as these are more significant.

Fibonacci retracements

In a normal trend, the impulse or first leg of the move normally retraces at either the 38.2/61.8%, 50%, or 61.8/38.2% areas. If the market moves beyond this point, that may suggest a full-blown reversal. Below is an example of this structure on GBPCHF’s weekly chart.

We see two instances where the price ‘hung around’ the 61.8% level before moving in the previous direction.

A weekly TradingView GBPCHF chart showing typical Fib retracements in a trend

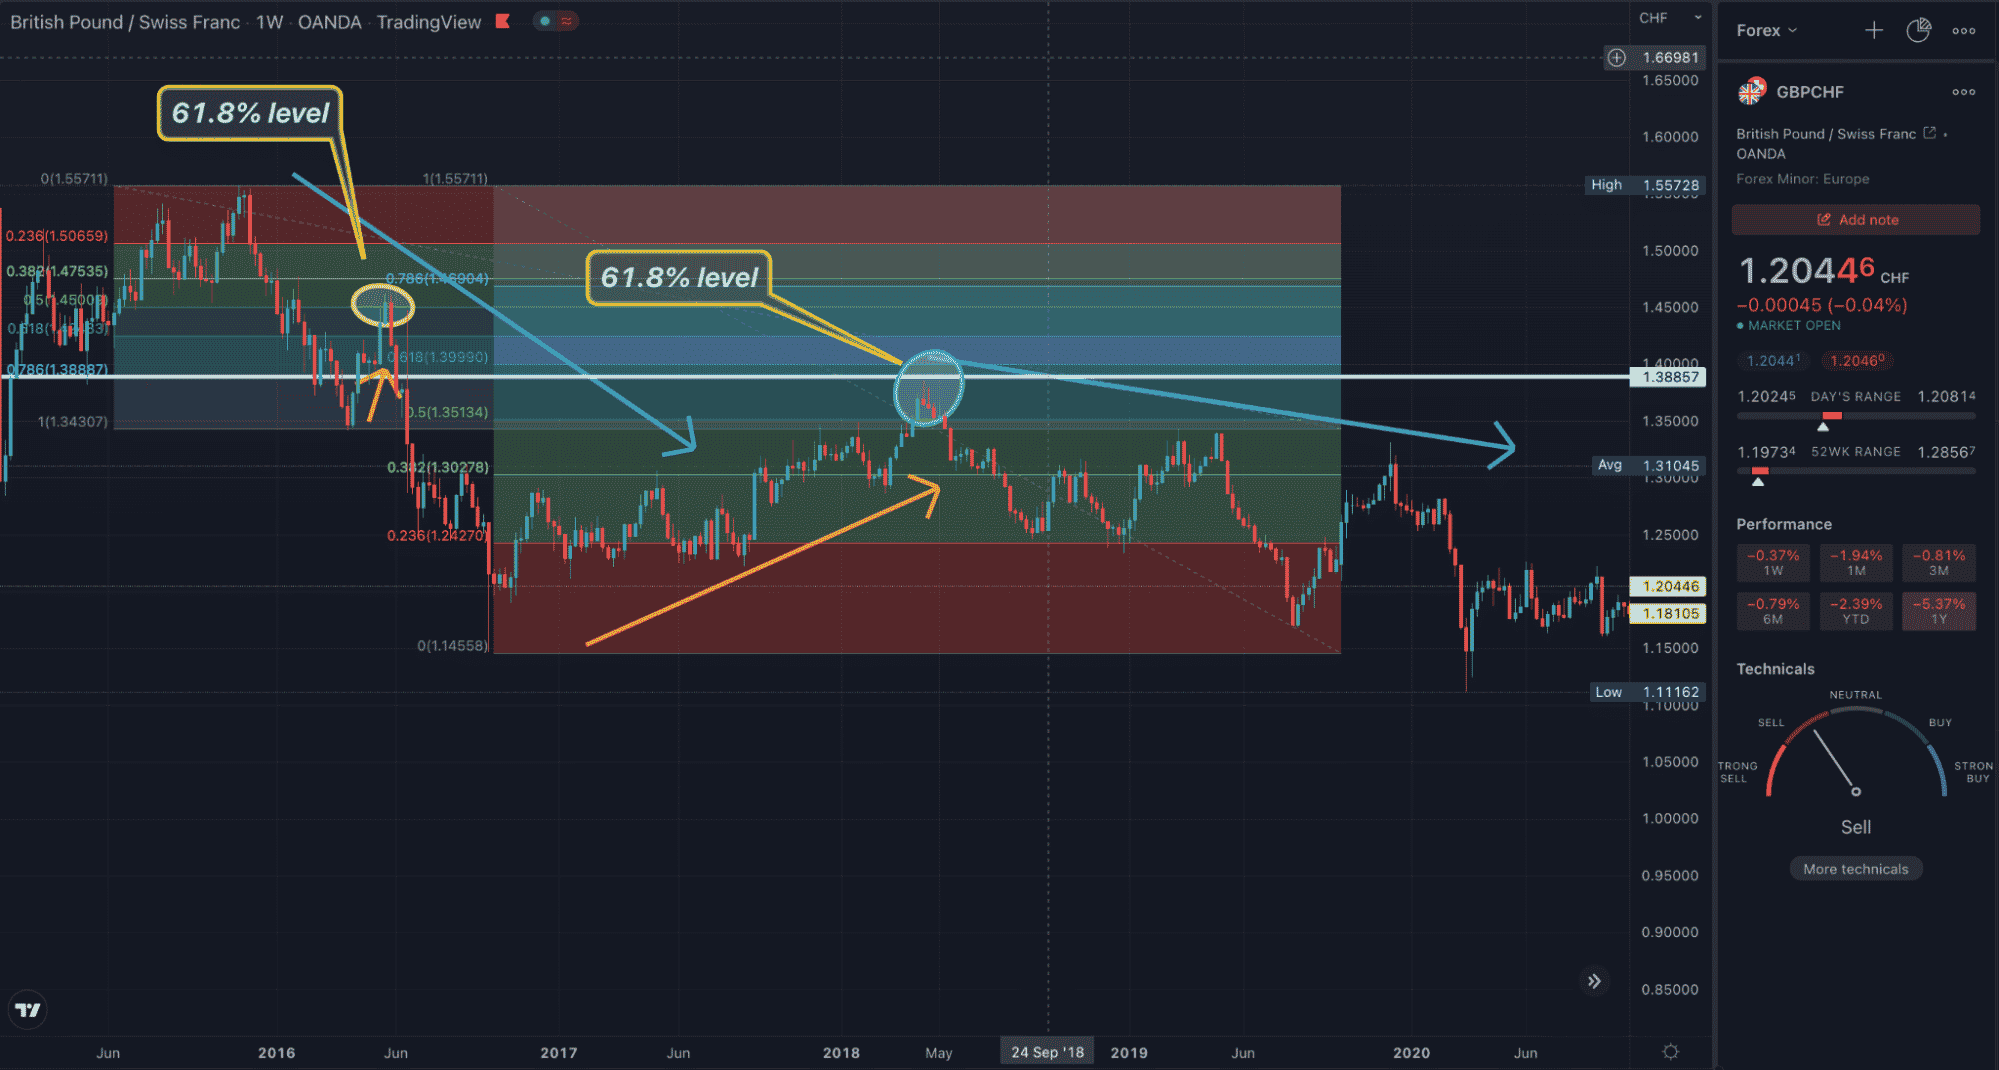
However, if the impulse is faster with shallower pullbacks, the price may stall at the 23.6% or 78.6% points before continuing. Regardless, you should observe other signs around the Fib levels like price action, support and resistance, patterns, and so on.

Fundamental and sentiment analysis

Last but not least is using fundamental or sentiment analysis. Changes in long-term fundamental data, especially interest rates, can provide a big clue before everything changes technically. When a reversal is at play, it’s often due to something changing economically or geopolitically within a pair.

A reversal may also occur for geopolitical reasons, such as wars, scandals, elections, and even terrorist attacks. Alternatively, you can use indicators like the Commitment of Traders report and the IG Client Sentiment Index for sentiment analysis.

Regardless, studying any of these underlying factors can undoubtedly help you anticipate a significant alteration in the price of a pair prior to using technical analysis.

Curtain thoughts

We should note that each trader perceives the market differently based on several factors, such as your point of reference. On the 1HR chart, one analyst may conclude a trend is still intact based on the price respecting the trend line, while another may view this as a reversal from a support and resistance zone on the daily chart. 

The point of this article is to provide you with the foundation of this crucial concept. Ultimately, what matters more is your individual perceptions based on extensive study and, most importantly, limiting your losses when things go the other way.

The Best Forex Robots Report Is Already Here!
best forex robots
Check out 30+ best expert advisors with daily updated live results and statistics
Click Here
ShareTweet
Previous Post

VVS Finance Decentralized Exchange Review

Next Post

Dfyn Decentralized Exchange Review

Related Posts

Short Selling and Strategies to Use

by Richard Brase
September 21, 2022
0

Are you interested in short selling? This can be a great way to make money if you are savvy and...

Scalping in Forex Trading

by Richard Brase
September 9, 2022
0

Heading in Forex is a trading approach that looks to make a tiny profit on each trade to compound those...

Best 5 Leverage Calculators Use Can Use for Free

Best 5 Leverage Calculators Use Can Use for Free

by Chintan Patel
May 30, 2022
0

Leverage is an important concept in forex and stocks trading. It refers to the amount of money that a broker...

KeyDifferences Between the Simple and Exponential Moving Averages

KeyDifferences Between the Simple and Exponential Moving Averages

by Chintan Patel
April 18, 2022
0

Moving Averages (MAs) are often the first indicator introduced to a newbie in any financial market. They remain the bread-and-butter...

Top 7 Most Valuable Currencies In 2022

Top 7 Most Valuable Currencies In 2022

by Tim Baudin
April 11, 2022
0

If you asked the average Joe with little knowledge of foreign exchange which currency they think is the most valuable,...

Load More

Leave a Reply Cancel reply

Your email address will not be published. Required fields are marked *

Best Forex Automated Systems

  • TechBerry 9/10
  • Happy Galaxy 8.5/10
  • Forex Cyborg 8.5/10
  • Forex Fury 8/10
  • FXgoodway 7.5/10
  • Best Forex Brokers
  • Best Forex Robots
  • Best Forex Signals
  • Best Forex Managed Accounts

Top Trading Markets

We are dedicated to demystify the world of forex trading for you – no matter what level you are on.

Categories
  • Automated Trading
  • Crypto Robot Review
  • Cryptocurrency Trading
  • Day Trading
  • Forex Basics
  • Forex Brokers
  • Forex Education
  • Forex Forecasts
  • Forex Indicators
  • Forex Market Commentary
  • Forex Robots
  • Forex Signals
  • Forex Signals
  • Forex Tools
  • Forex Trading Strategies
  • Forex VPS
  • Fundamental Analysis
  • Managed Accounts
  • Money Management
  • News
  • Review
  • Review Platforms
  • Risk Management
  • Social Trading
  • Technical Analysis
  • Top World Traders
  • Trading Apps
  • Trading Psychology
  • Uncategorized
Tags
Acquisition AI Amazon Apple Artificial Intelligence Bitcoin bond yields CEO China earnings earnings report economy Electric Vehicles Federal Reserve financial performance Financial Results forex ea forex software reviews Growth Guidance Housing Market inflation interest rates Investing investment Investors Market Volatility merger mortgage rates net profit Nvidia Oil prices Q2 Results revenue Revenue Growth Sales sales growth Stock Futures stock market stock performance Stocks strategies technology Tesla Video
  • Terms of Use
  • Privacy Policy
  • Compensation Disclosure
  • Risk Disclosure
  • About Us
  • Contact Us

Copyright © 2023 by ForexEzy.com

No Result
View All Result
  • Top Forex Advisors
    • Best Forex Robots
    • Best Forex Signals
    • Best Managed Accounts
  • Top Forex Brokers
    • Best Forex Brokers
    • US Forex Brokers
    • UK Forex Brokers
    • MT4 Forex Brokers
    • MT5 Forex Brokers
    • Zero Spread Brokers
    • Best PayPal Brokers
    • TradingView Brokers
    • Social Trading Platforms
  • Top Review Platforms
  • Forex Education
    • Getting Started
    • Forex Basics
    • Forex Trading Strategies
    • Money Management
    • Risk Management
    • Technical Analysis
    • Fundamental Analysis
    • Trading Psychology
    • Social Trading
    • Automated Trading
  • Forex Tools
    • Forex Robots
    • Forex Indicators
    • Forex Signals
    • Forex VPS
  • Forex Forecast
  • Crypto
    • Best Crypto Exchanges
    • Best Crypto Bots
    • Crypto Guides & Forecasts

© 2023, Forexezy. {copy} {year}