Moving Averages (MAs) are often the first indicator introduced to a newbie in any financial market. They remain the bread-and-butter approach in chart and time series analysis. Some of the most experienced investors will rely primarily on Moving Averages to identify trends with proven success.
In fact, most indicators will feature an MA somewhere in their construction. We get many types of Moving Averages since several methods of calculating them exist.
However, the most unanimously used continue being Simple and Exponential. These have some subtle but noteworthy differences, which we’ll explore further here in this article.
The basics of Moving Averages
Moving Averages are the most basic approach for traders to identify whether a market is on an uptrend or downtrend.
MAs rely on the principle that if the price is higher than its average over a set period, it’s likely to continue moving in that direction; the opposite is true when it’s lower than the average over a certain number of days.
Proponents of MAs believe in mean reversion, referring to the concept that an asset’s price will always revert to its average (mean) over time.
In simple terms, any well-established trending market consists of many pullbacks as it moves in a step-like motion. MAs are one tool used to pinpoint entries into these scenarios.
The main differences between SMAs and EMAs
As previously mentioned, we have the simple (SMA) and exponential (EMA) Moving Average. An SMA takes the closing prices over a certain number of days and divides it by that period.
For instance, a 10-day SMA will take the closing prices over the past ten days, divide them by ten, and that’s it. However, the EMA is slightly different. Its calculation will add a smoothing constant of 2/(1+N), where N equals the number of days.
This weighting results in the EMA placing greater relevance on recent prices than all prices in a period. The EMA is designed in a way where each data point decreases in weight over time as new data is added.
Therefore, most analysts agree that the EMA is slightly better as it’s more sensitive to newer values that are considered the most relevant. The chart below shows the SMA (in blue), and EMA (in orange) plotted on a GBPCAD daily chart using the same 100-day period.
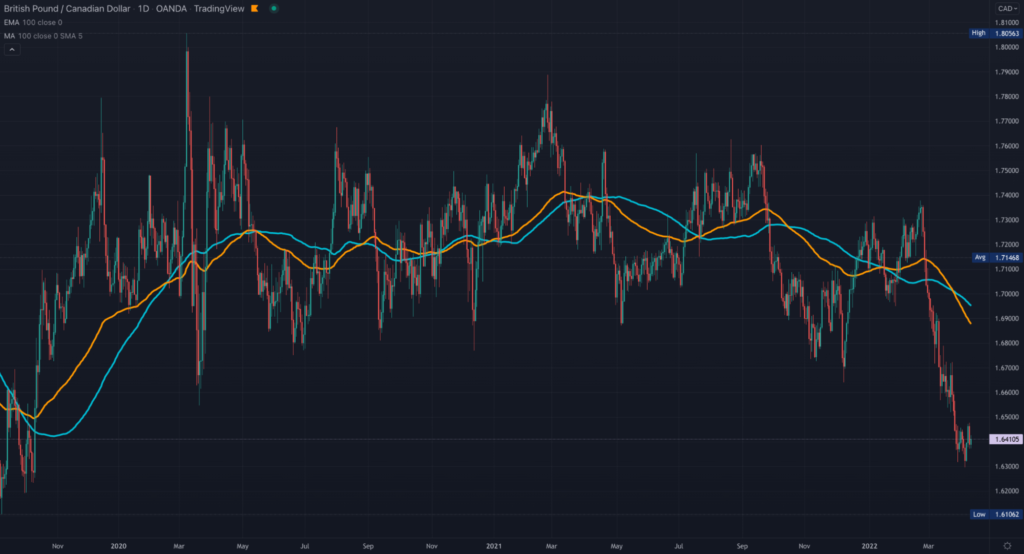
There doesn’t seem to be much of a difference to the naked eye as both Moving Averages appear to follow the same trajectory. Yet, in the following sections, we’ll explore the pros and cons of each.
The pros and cons of SMAs
Long-term traders typically favor the SMA as they prefer its slowness. As these individuals don’t rush into executing trades, they can afford to wait a little longer until the MA provides a signal.
Ultimately, the SMA will generally get you later into a trend than its counterpart. However, on the other side, it can keep you longer once in a trade than the EMA as it’s less sensitive to price. Let’s go over an example of these occurrences in more detail.
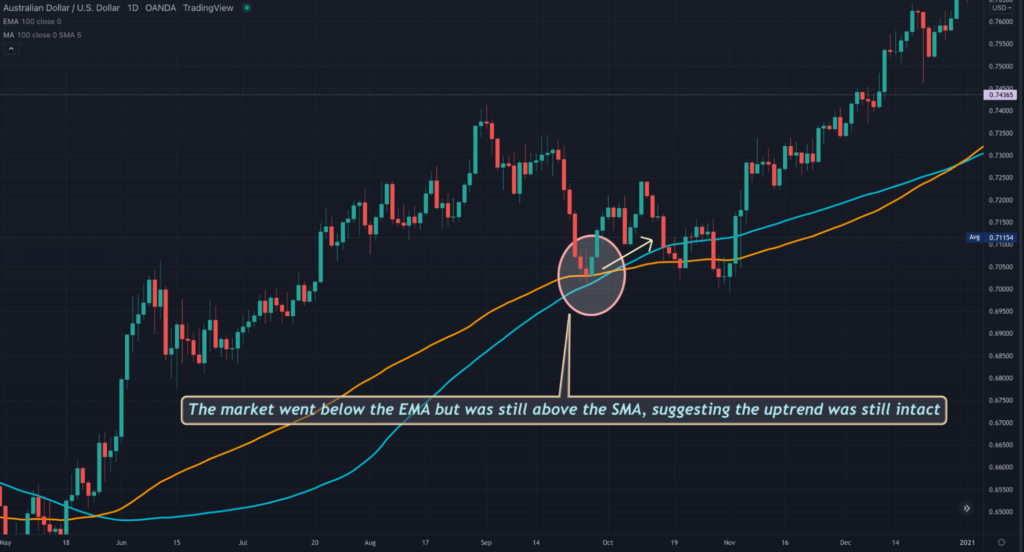
The AUDUSD daily chart shows us where the SMA could have helped a trader not be ‘spooked’ into believing the trend has changed. We can observe the price went under the EMA but not the SMA, which would have implied the uptrend was still in place.
Conversely, the image below shows the main downside of the SMA. On the weekly chart of EURUSD, we see that the price (in the orange ellipses) went below the EMA before the SMA.
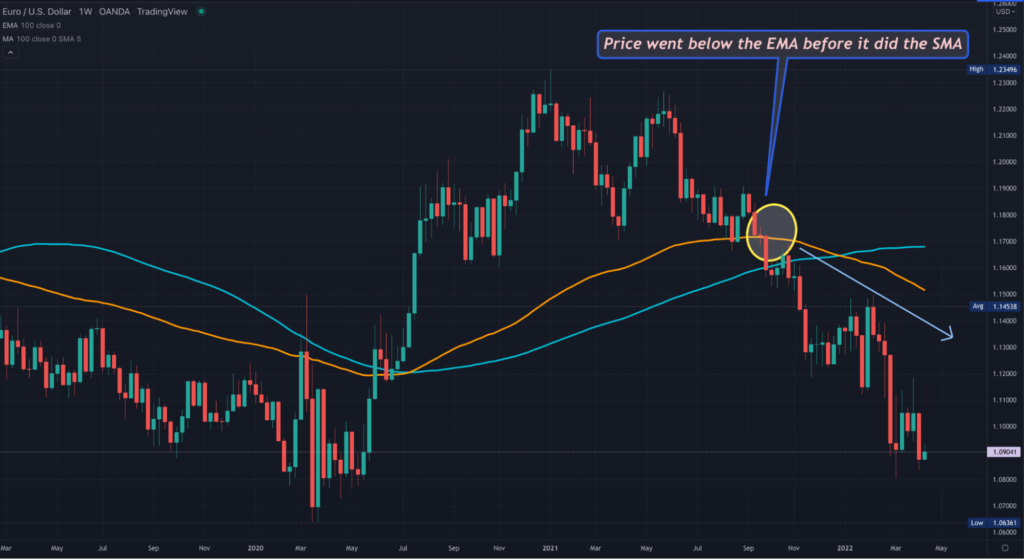
If one waited for the market to be under the SMA, they would have entered later into the eventual move, missing out on tens of pips.
The pros and cons of EMAs
EMAs exhibit the opposite qualities of SMAs. Short-term traders, such as day traders and scalpers, prefer these Moving Averages as they react more quickly to price.
If you’re trading in the short term, you rely on constantly changing information, and this is what the EMA offers. However, on the flip side, the EMA will often get you out of a position prematurely where the market may end up continue trending in its previous direction.
As we did with the SMAs, we’ll go over some instances of what we mean in greater specifics. On the NZDCAD 4HR chart below, we see in the ellipse how the price was above the EMA but below the SMA.
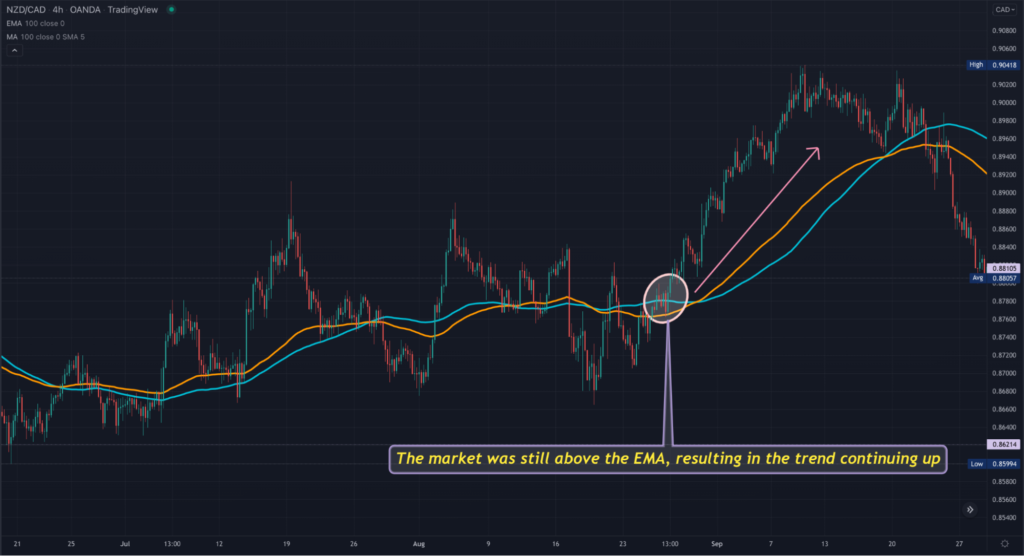
If a trader took a signal from the latter, they might have assumed the trend had changed from up to down. However, as the EMA is quicker at spotting trend changes, it provides a bullish signal. After this point, we see the market move upward.
The market was still above the EMA, resulting in the trend continuing up. Let’s now look at where the EMA would have been a disadvantage. On the chart below, we can view the market was trending down before retracing.
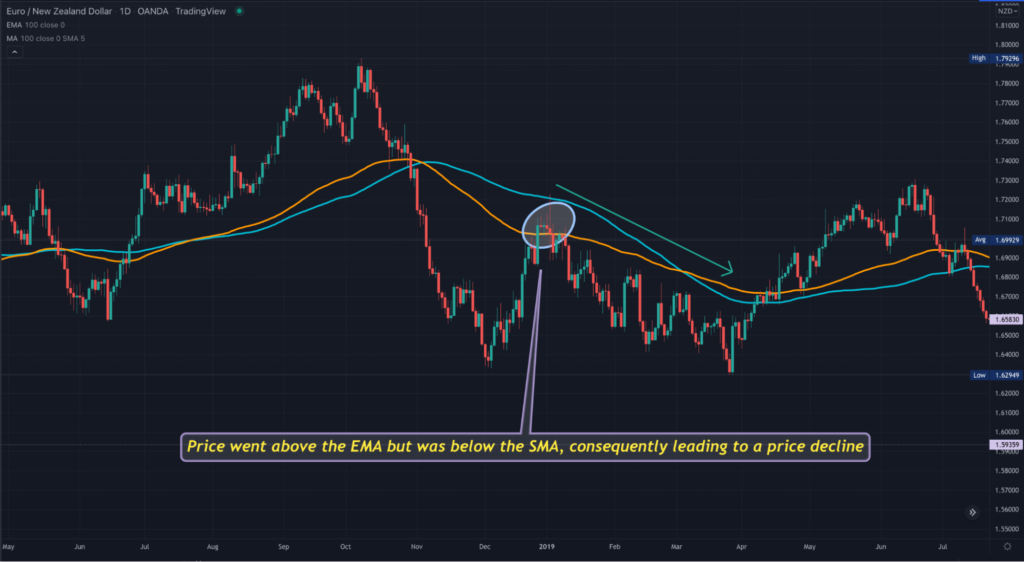
Price did go above the EMA (which may have signaled to the trader that the trend was now bullish). Yet, the SMA presented a more reliable trigger (due to its slowness), resulting in continued bearishness.
Curtain thoughts
Ultimately, the SMA is a better candidate for managing trades. Because of its dynamic reaction, the EMA is suited for entering earlier into trends. Yet, as we’ve explored already, the SMA is less reliable for entries, while the EMA is less dependable for trade management.
Therefore, these are some of the subtle but critical differences between the two. We should note that it’s not just the type of Moving Average that matters; the period and time frame are also crucial, as any slight adjustment will produce wildly different results.
So, truthfully, no Moving Average is necessarily better than another, leading traders to experiment with a range of periods, types, and time frames to find what works most consistently for their style, strategy, and experience.


