The name “Moving Averages” is self-explanatory and refers to the average ”moving” with each price period. Among the multiple moving averages that have emerged, the SMA or Simple Moving Average is one of the simplest forms. An SMA is either fast or slow, depending on the period used and just averages past prices.
Another Moving average that is used is called EMA or Exponential Moving Average. The EMA not only averages price but also uses a multiplier as a smoothing factor. This makes it more relevant for performing current price analysis. Compared to the SMA, an EMA is closer to the price, thus reducing the lagging factor which is one of the prevalent limitations of trading with moving averages.
There are multiple trading strategies that can be implemented using Moving Averages. In this article, we aim to present five trading strategies in brief.
1. Using Multiple Moving Averages
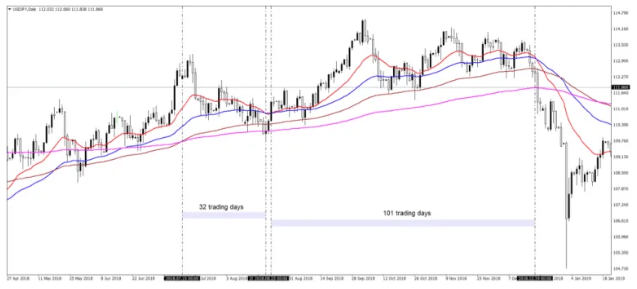
The first trading strategy involves applying multiple averages on a chart in an attempt to find trending conditions that are perfect. For this, a trader needs the EMA (20), EMA (50), EMA (100) and EMA (200). This strategy focuses on looking at the order of the averages which are aligned in the order of the periods, which are indicated in brackets.
Thus, the rule for a bearish setup is EMA (20) <EMA (50) <EMA (100)<EMA(200). Similarly, the rule for a bullish trend is EMA (20)>EMA (50)>EMA (100)>EMA(200). In the Bullish example below, EMAs are plotted for a USD/JPY daily chart, with the EMA (20) sitting above all the other EMAs
2. Support and Resistance When using Moving Averages
This is a classic strategy using moving averages in trading. To apply this strategy, traders have to first apply the desired moving averages on the chart, which is ideally the 50, 100, and 200 EMAs. Traders should then look at the market condition to see if it’s bullish or bearish. Generally speaking, the market is said to be bullish when the price is located above the moving average and bearish when the price is located below the moving average. Traders should go long or short, targeting either new lows or highs when the market touches the moving average. They should always look to incorporate a risk-reward ratio which is based on the distance to the take profit level.
3. Derived Moving Averages Trading Strategies – Golden and Death Crosses
The Golden or death cross strategy originated from the stock market initially, and now uses the SMA as the classic setup. It involves two moving averages, namely, the EMA (200) and the EMA(50). The EMA is chosen as it gets better results because of reduced lagging. The market forms a death cross when the fastest average moves below the slower one. This indicates that the trader should sell. Consequently, when the faster average moves above the slower one, a golden cross is formed, indicating traders to buy.
4. EMAs With RSI Strategy
Moving averages are often combined with oscillators when using them during trading. An oscillator can act in different ways, generally filtering out false information produced by current price action. Just like a moving average, an oscillator also considers multiple periods before plotting any value, appearing in a separate window at the bottom of a chart.
Combining EMAs with the RSI or relative strength index oscillator is an example of a strategy combining moving averages with oscillators. To better understand this strategy, we will take the help of a EUR/AUD chart, as given below.
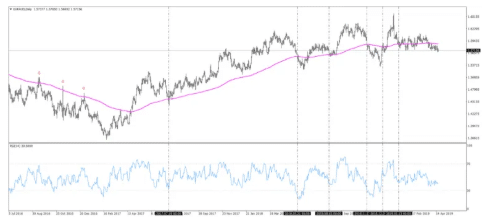
The above chart has the EMA (200) plotted on it, showing the recent price action on the cross. The vertical lines seen on the chart shows the point where the price reaches the EMA level and its corresponding RSI value. When interpreting signals based on both the EMA and RSI, several steps have to be followed. Traders have to first wait for the price to reach the EMA and check whether the RSI is between the 30-70 range.
Traders can then use the RSI to filter the price move into the EMA. They should always check what the RSI says when the price reaches the EMA and closes beyond it. The RSI must be above the 30 level for a bounce from the EMA. It should close below 30 for a continuation into further bearishness.
5. Pattern’s Final Legs Forming Around MAs in Trading
It is a known fact that technical analysis can be considered an art of interpreting patterns. Traders first search for similar patterns, document them, and then interpret the current price action to trade similar situations. However, traders should also note that not all patterns tend to work all the time. There have been instances where head and shoulders patterns have failed for traders using pattern recognition, or when a rising wedge doesn’t fall all the time. Hammer patterns can also be invalidated by future price action, forcing the traders to put a stop loss and risk-reward ratio in place to keep his/her account safe.
However, patterns work best when there is an incentive to trade them, and moving averages solve this purpose in trading. The following strategy involves the EMA (200) applied on a EUR/USD daily chart, as given below.
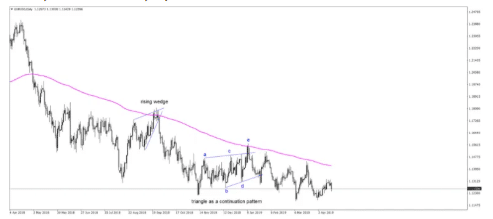
In the chart above, traders have to look at the last leg of either a continuation or reversal pattern and see whether it touches the EMA (200). There are two possibilities to go “short” the pair, as indicated by the pink line.
Here, the price reaches the EMA during the last phase of a rising wedge, as a rising wedge almost always “falls” which brings a bearish sentiment to the market. The pattern is reinforced when its last phase is formed when the price reaches the moving average. The price then reaches the EMA during the last leg of the contracting triangle. The triangle thus acts as a continuation pattern because the bearish trend is already in place.
Conclusion
The above strategies using moving averages are all well-known and focus mainly on combining money management elements for benefiting trading accounts. While most traders prefer the trending component of a moving average, it can be used in other ways as well.
The above article highlights how some moving averages can be combined with other technical analysis indicators and patterns, offering a clear distinction between bullish and bearish markets. Trading using moving averages offer a great trading experience especially if a trader combines money management rules and trading signals generated by the moving averages.


