
2-Period RSI strategy is a common trading strategy that traders and forex expert advisors leverage to squeeze profits while trading a wide array of securities in the capital markets.
A brainchild of Larry Connors, this simple forex strategy can be used to supplement other trading strategies such as scalping, trend trading, or hedging.
2-Period RSI Strategy Basics
The trading strategy gains its popularity on its ability to make it possible for technical traders and FX expert advisors to identify ideal entry and exit points in the market.
Based on the relative strength index, the strategy finds excellent use in trend trading to identify oversold and overbought market conditions. As an essential forex trading instrument, the relative strength index has readings of between 0 and 100.
The 2-period RSI strategy depends on these readings to ascertain overbought and oversold conditions. In this case, automated trading tools and independent traders look for buy opportunities whenever the reading on the RSI indicator is below 5.
Likewise, one would look for short-selling opportunities when the RSI reading is above 95. The forex strategy finds great use when dealing with a long-term trend. In addition, it is not effective in identifying major tops and bottoms.
2-period RSI strategy Basics Steps
Step 1: Identifying Underlying Trend
The first step in using the 2-period RSI strategy to squeeze some profits entails identifying the primary trend. As a money-making hack using this forex strategy, it is essential to use the 200-day simple moving average to identify the underlying long-term trend (figure 1).
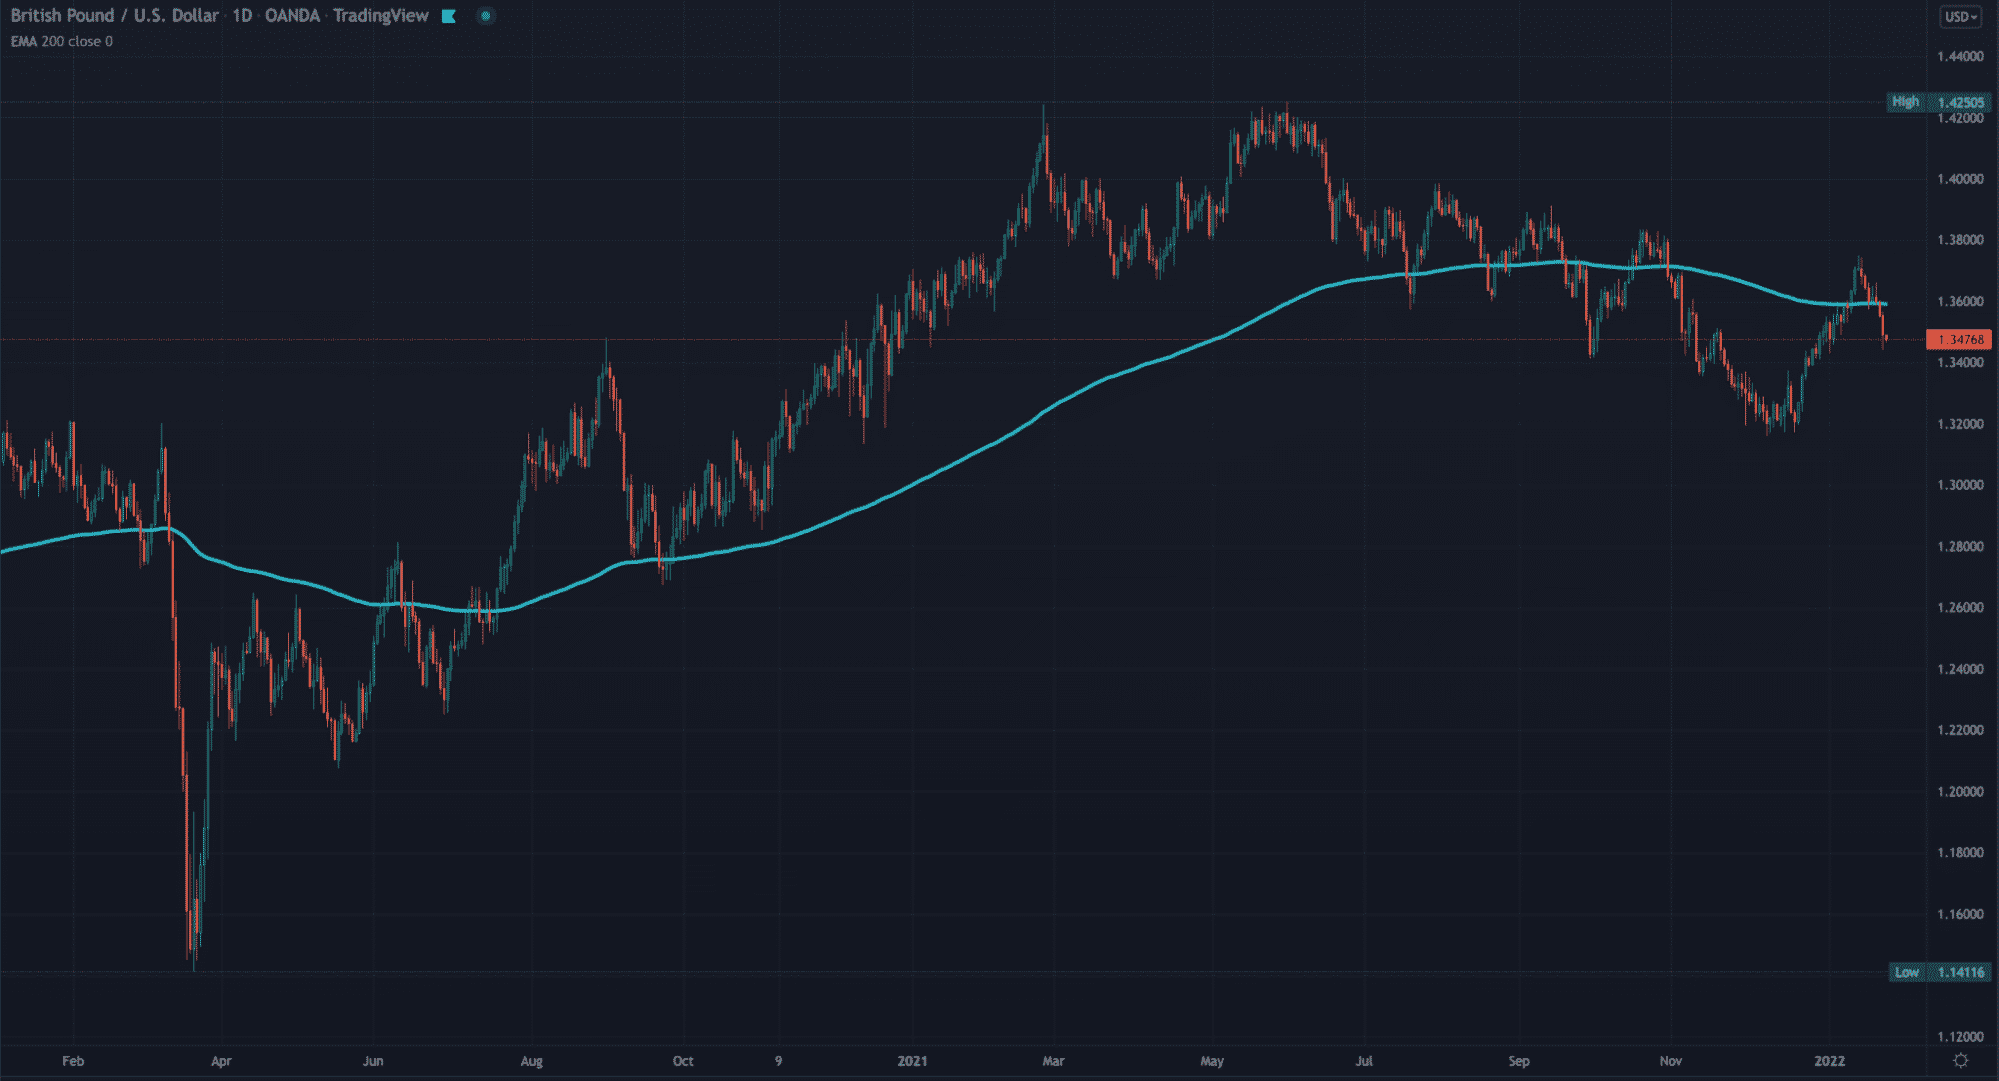
Likewise, according to Connors, if the price is above the 200MA on the daily chart, then the underlying security is considered to be in an uptrend. In this case, traders and forex robots would look for buy opportunities while leveraging the 2-period RSI forex strategy.
Similarly, whenever the price is below the 200-day moving average, the underlying security is billed to be in a downtrend. In this case, a trader or a forex EA would look for selling opportunities.
Step 2: Identifying Buy and Sell Opportunities
The next step entails using RSI as one of the best forex indicators for automated or manual trading to identify buy and sell opportunities along with the bigger trend. According to Connors, traders should look for sell opportunities whenever the RSI indicator is above 95.
According to Connors, returns tend to be much higher whenever one sells a security when the reading in the RSI is above 95 and not 90, given the extreme overbought conditions.
In addition, the proprietary trading strategy developer found that returns tend to be much higher when buying a security when the RSI reading is below 5 and not 10.
RSI readings below 5 are associated with extreme oversold conditions most of the time. Conversely, prices tend to correct higher on traders’ automated FX trading tools taking advantage of the unique market opportunity.
Step 3: Actual Buy and Sell
Once buy and sell opportunities have been identified based on RSI readings, the next step entails carrying out the actual buy and sell. Timing, in this case, is of great essence as a vital forex trading skill while using this RSI strategy.
According to Connors, trades, be it short or long, should be opened before the close of the underlying candlestick. In this case, a trader or an automated forex trading tool always stands a higher chance of generating higher returns on prices gapping in the direction of the trade.
However, traders can wait for a new candlestick to open as it gives more flexibility and can improve entry levels.
Step 4: Exit Point
Once a position, be it long or short, is opened, it would be wise to think of an exit strategy. In this case, the system will make it possible to lock in as much profit as possible. Similarly, the exit strategy would limit the losses accrued should a trade go against you.
In a short position, it would be wise to exit the position once the price moves below the 5-day moving average to lock in profits generated. Likewise, in the case of a long trade, one would lock in profits once the price moves up and closes above the 5-day moving average.
2 period RSI scalping settings
The period of Larry Connors’ RSI is, by default, 3 on most charting platforms, which is preferable for scalping purposes. Traders might go down to 2 or 1, although this will probably be nosier.
As with any scalping system, traders also look for set-ups on lower time frames, namely those from the 15-minute and below. Yet, the 1-minute chart is usually the most preferred.
MA role in RSI 2 period strategy
As previously mentioned, the central role of using a moving average with the 2 period RSI strategy is to identify the long-term trend, with the 200-period being the most commonly utilized.
This setting is typically used on time frames starting from the 4HR to the monthly. Other popular periods include the 50 and 100, which lean towards the medium-term trends.
For the short term, 5, 10, and 25 are the prevalent moving average periods used on time frames from 15-minute and below. Overall, analysts consider these settings as the most reliable.
Traders can use a crossover of two moving averages for extra confirmation, e.g., 200 with the 100 or 100 with the 50.
Any RSI forex strategy only gives information on momentum and helps find the best entry. Yet, the moving average is significant for identifying the trend which forms the foundation of the dominant price prediction.
Larry RSI trading strategies
The central concept behind the 2 period RSI for forex is looking for extreme pullbacks within a trend using overbought and oversold conditions away from the standard 70 and 30 lines.
As previously mentioned, Connors recommends setting the oscillator at 95 for overbought and 5 for oversold with this RSI forex strategy. The chart below shows the 2 period RSI with a 200-day moving average for identifying an entry and exit.
However, in our example, we’ve used the 85 line for the overbought band and the 15 line for the oversold band. This is because you may not get enough opportunities with 95-5 as these are rare extremes.
What’s more crucial is having your RSI and moving average present a reasonable number of reliable set-ups—nonetheless, the steps below present two factors with this RSI forex strategy.
First, you identify the trend; second, the dip from the 85 or 15 line needs to occur within the movement rather than against it (figure 2). In simpler terms, we look for mean reversion towards a trend-identifying indicator (moving average) after observing an extreme oversold or oversold event.
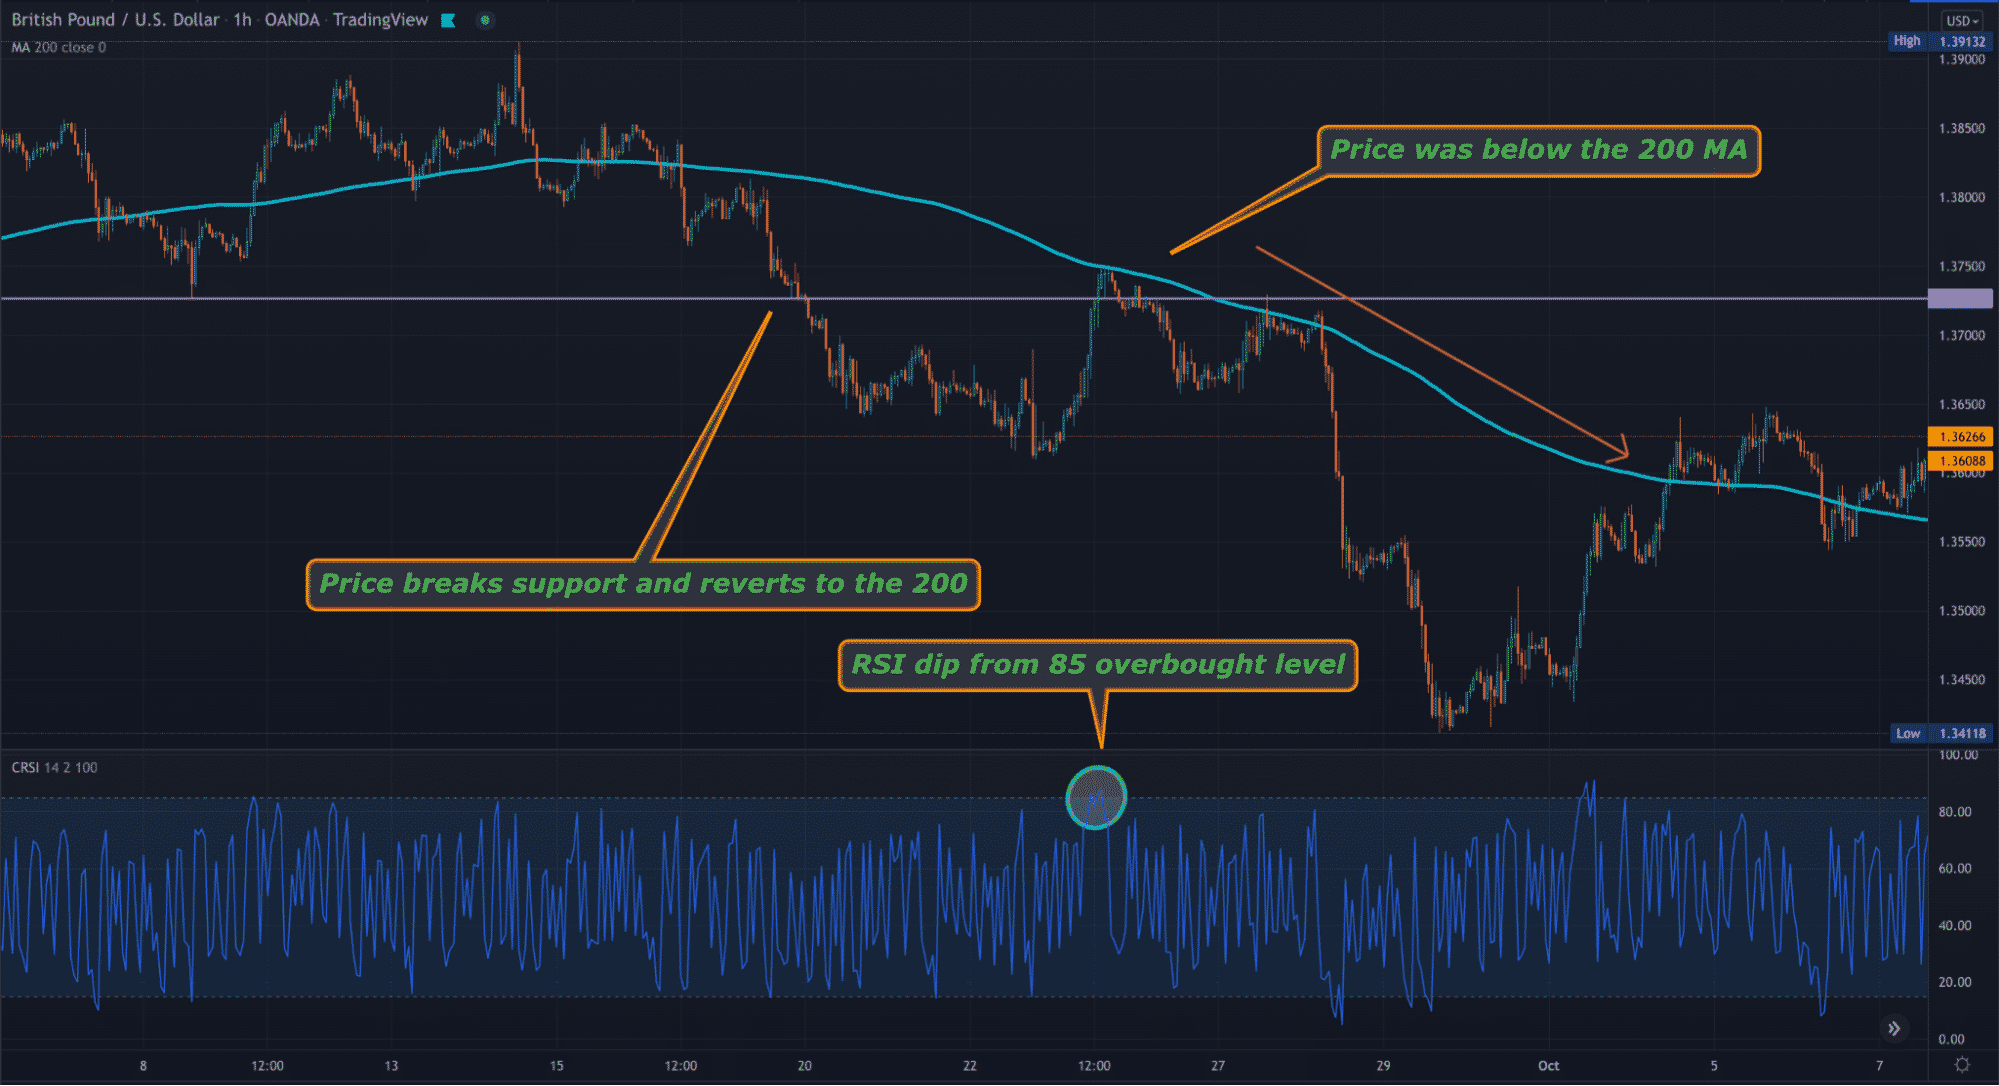
We can see the market traded below and above the 200-day moving average. From 16 September, the price began moving aggressively to the downside, breaking the previous support level.
Afterward, the market retraced back to near the moving average. Traders would have noted how the RSI was behaving towards the 85 line.
To confirm the entry trigger, one must wait for the RSI line to close below the 85. For extra confirmation, it’s best to enter after the closing of a few candles. This activity should happen with the price still below the 200-day moving average.
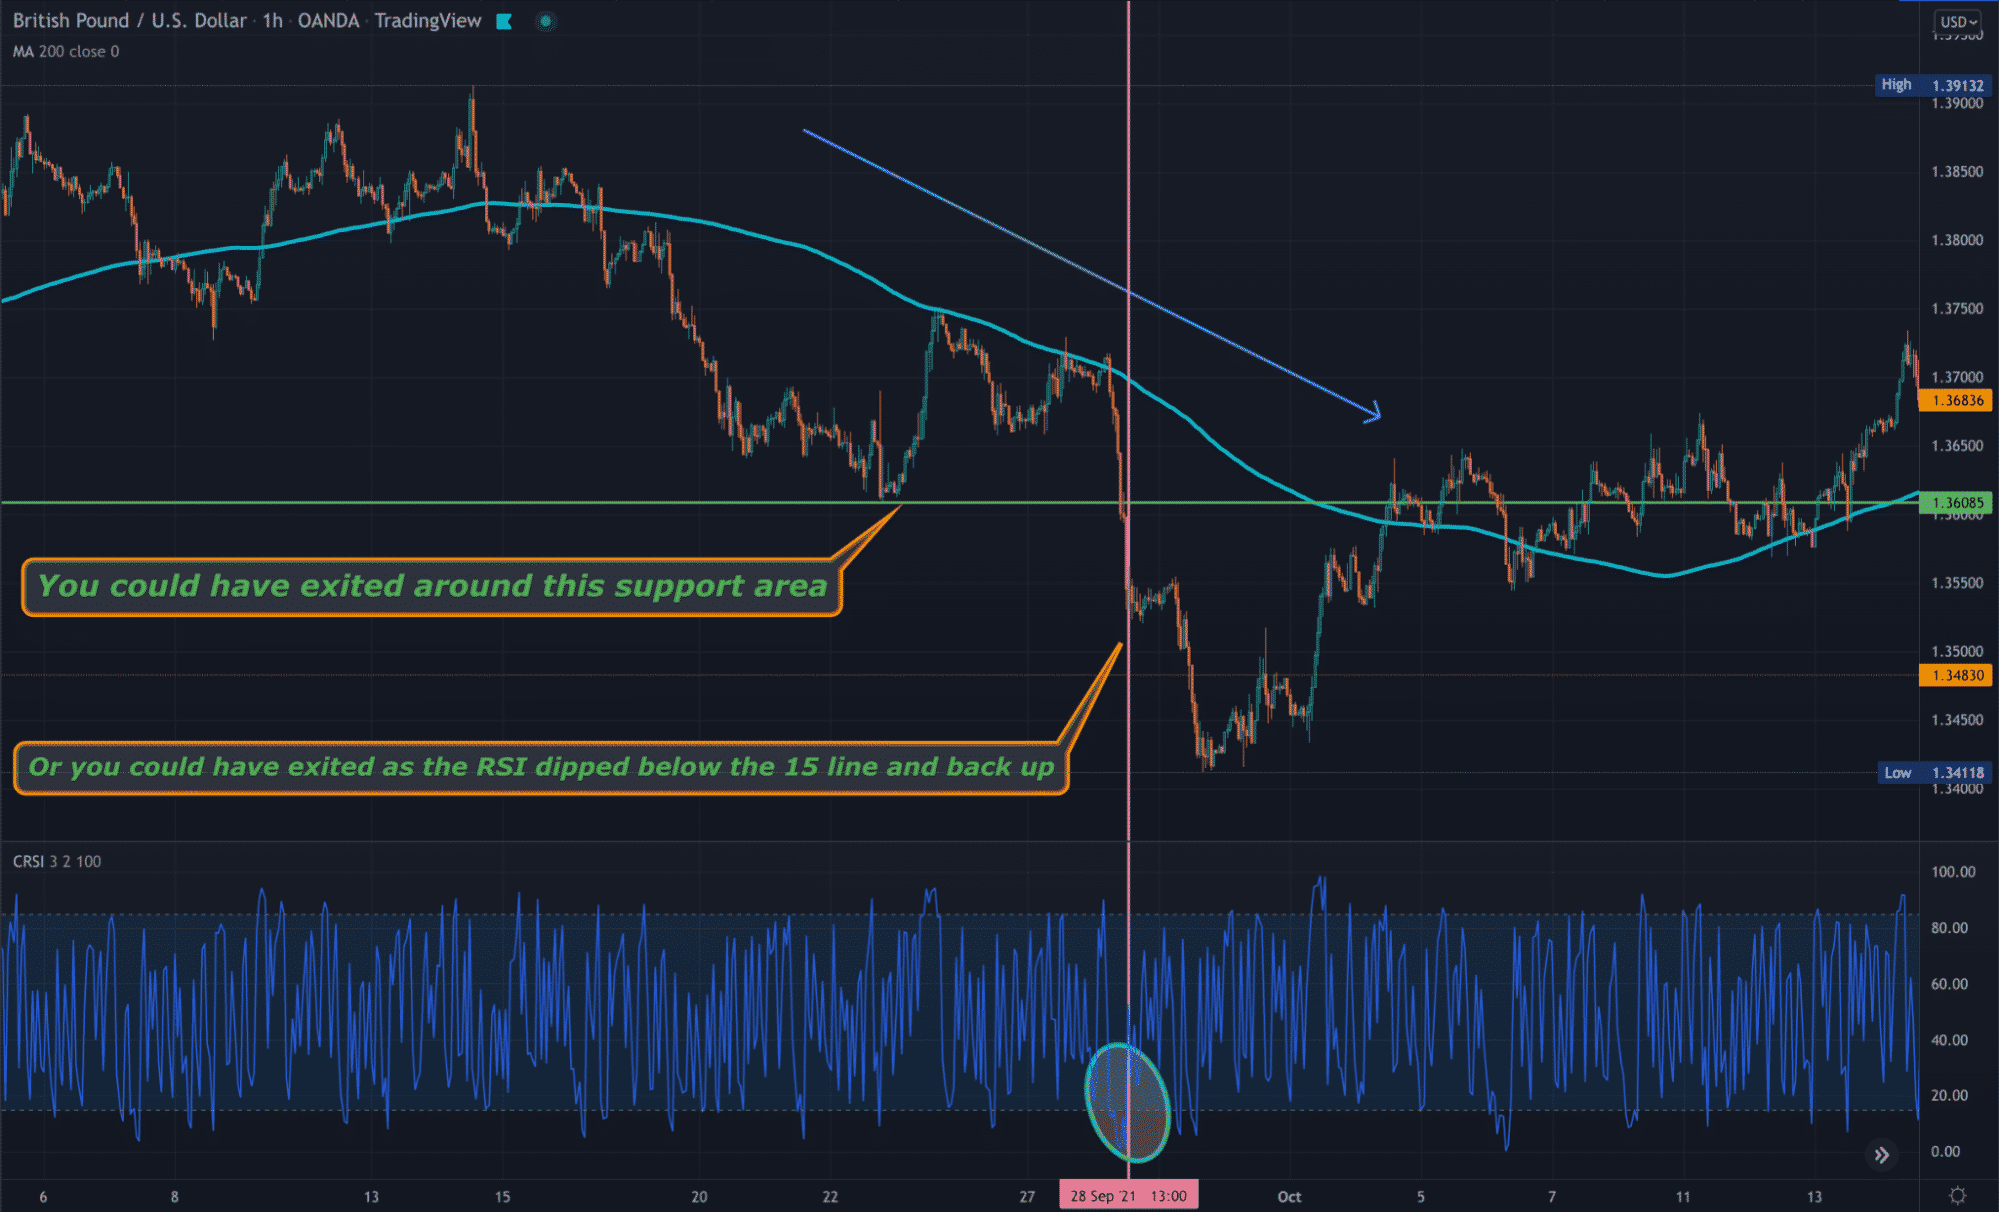
At this point, you can enter with your stop loss at the high of the candle aligning with the overbought RSI line. Assuming the position is still moving in your favor, there are several exit strategies to consider (see figure 3 above).
The most logical method is a nearby support or resistance level. In our main example, the price had been moving quite strongly to the downside, although this might always be the case.
Yet, if this did occur, you could trail your stop to a logical level and take profits once the RSI hits the OS area.
Generally speaking, you can use the 2 period RSI as entry triggers for any trading system by looking for dips in overbought and oversold levels. After you’ve confirmed whatever is necessary for your trading plan to identify a buying or selling opportunity, this indicator can be the last step before an entry.
2 period RSI calculation
The 2 period RSI is made up of three components, namely the actual RSI period (a default period of 3), the UpDown length (2), and the rate of change/ROC (100).
The UpDown length (also known as the streak) refers to how many consecutive days the price has closed higher than the previous day or lower than the previous day.
ROC (or relative magnitude of recent price change) refers to the most recent price change as a percentage compared to a preceding period.
The result is the following formula:
[ RSI (3) + UpDown Length (2) + ROC (100) ] / 3
The indicator then uses this formula to produce a value between 0 and 100.
Bottom Line
2-period RSI strategy is an ideal short-term forex strategy for traders looking to generate quick profits through scalping or news trading. The trading strategy leverages the relative strength index indicator to identify overbought and oversold conditions.
Similarly, short positions are opened whenever a signal candle occurs in overbought conditions indicating that the price is about to reverse downward.
Likewise, short positions are opened whenever a signal candle in the form of a bullish candlestick occurs whenever the price is in oversold conditions below the 95 RSI indicator reading.


