ForexEzy
No Result
View All Result
  • Home
  • Getting Started with Forex
  • Forex Education
    • Forex Basics
    • Forex Trading Strategies
    • Money Management
    • Risk Management
    • Technical Analysis
    • Fundamental Analysis
    • Trading Psychology
    • Social Trading
    • Automated Trading
  • Forex Tools
    • Forex Robots
    • Forex Indicators
    • Forex Signals
  • Top Forex Brokers
  • Top Forex Robots
  • Commentary
  • Blog
No Result
View All Result
ForexEzy
No Result
View All Result
Home Forex Education Technical Analysis

What is Relative Strength Index (RSI Indicator) ?

by Tim Baudin
September 6, 2016
in Technical Analysis
0
What is Relative Strength Index (RSI Indicator) ?
0
SHARES
11
VIEWS
Share on FacebookShare on Twitter

RSI (Relative Strength Index) is an extremely popular and widely used leading or momentum indicator developed by J. Welles Wilder. RSI gauges the speed and change of price movements.

https://youtu.be/RrqQ5WGCbp4

Like most of the leading indicators, RSI has a range. It’s an Oscillator. This means it ranges between 0 to 100 levels. Due to this, the value of RSI can not be lower than 0 and can not be higher than 100. Traders use 3 psychological levels of RSI to take trading decisions. These levels are 30, 50 and 70.

The basic rule to use RSI is identifying overbought and oversold situations. When RSI value is below 30 then it is oversold, and when RSI value reaches above 70 then it is the overbought situation. RSI can also detect trend and divergences.

RSI Calculation :

To calculate RSI, we need to find out the value of RS first.

RS = Average of X day’s up closes/Average of X day’s down closes

Now,

RSI = 100 – 100/ (1+RS)

Default and widely used parameters of RSI are 14. However, many traders use 7 and 28 periods.

Now let’s take a look at RSI indicator,

Relative-Strength-Index

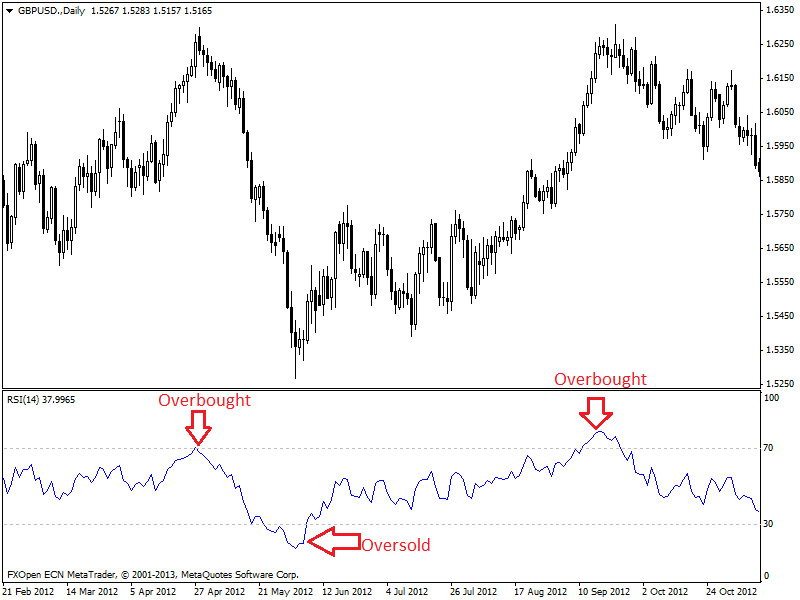
In the daily chart of GBP/USD given above, we can see the oversold signal when RSI<30 and overbought signals when RSI>70.

ShareTweet
Previous Post

Understanding Moving Averages

Next Post

How To Use RSI Indicator While Trading

Related Posts

An Introduction To Forex Indicators

An Introduction To Forex Indicators

by Chintan Patel
January 1, 2021
0

What are the Forex indicators? A vast part of technical analysis is understanding and trading with these tools. Although they...

Using Trendlines and Saucer Formations in Trading

Using Trendlines and Saucer Formations in Trading

by Tim Baudin
December 21, 2020
0

Trendlines are those lines that you can recognize easily. A trader draws trendlines on charts in order to connect a...

RSI - Top 3 Real Charts You've Missed

RSI – Top 3 Real Charts You’ve Missed

by Tim Baudin
December 17, 2020
0

Overview Are you still doubting the power of the RSI? This article will cover three recent forex trading opportunities mostly...

The Trading Indicator You Have not Heard of – The Williams %R

The Trading Indicator You Have not Heard of – The Williams %R

by Adam Stanley
December 1, 2020
0

The Williams Percentage Range is a highly effective tool that measures price variations over a period of time for various...

How to Use Technical Analysis in the Market?

How To Use Technical Analysis In The Market?

by Adam Stanley
November 25, 2020
0

If you are trading in the market, you’ll know that uncertainty and risk lurk at every step. In such a...

Load More

Best Forex EA

  • ROFX 9/10
  • Forex Fury 8/10
  • FXgoodway 7.5/10
  • Z Trader FX EA 7/10
  • Forex Incontrol Reborn 6.5/10

Popular News

  • The Best RSI and CCI Combination Trading Strategy for Optimum Returns

    The Best RSI and CCI Combination Trading Strategy for Optimum Returns

    2 shares
    Share 2 Tweet 0
  • Rofx Review – High Profitability and Stable Performance Analysis

    29 shares
    Share 29 Tweet 0
  • The Best Forex Scalping Strategy – Using 3 Popular Technical Indicators

    0 shares
    Share 0 Tweet 0
  • The Best MT4 Indicators & Expert Advisors For Forex Trading

    2 shares
    Share 2 Tweet 0
  • How to check if the indicator is repainting?

    2 shares
    Share 2 Tweet 0

Trading

Footer

We are dedicated to demystify the world of forex trading for you – no matter what level you are on.

Categories
  • Automated Trading
  • Day Trading
  • Forex Basics
  • Forex Brokers
  • Forex Education
  • Forex Forecasts
  • Forex Indicators
  • Forex Market Commentary
  • Forex Robots
  • Forex Signals
  • Forex Tools
  • Forex Trading Strategies
  • Fundamental Analysis
  • Money Management
  • News
  • Risk Management
  • Social Trading
  • Technical Analysis
  • Top World Traders
  • Trading Psychology
  • Uncategorized
Tags
arbitrage atr bollinger bands cci chart patterns classics copy trading courses day trading forex brokers forex charts forex ea forex education forex forecasting Forex Indicators forex software reviews grid trading hedging ichimoku macd market cycles news trading oscillators price action trading rsi social trading strategies tips & tricks trading bots trading platforms trend trading Video
  • Terms of Use
  • Privacy Policy
  • Compensation Disclosure
  • Risk Disclosure
  • About Us
  • Contact Us

Copyright © 2020 by ForexEzy.com

No Result
View All Result
  • Home
  • Getting Started with Forex
  • Forex Education
    • Forex Basics
    • Forex Trading Strategies
    • Money Management
    • Risk Management
    • Technical Analysis
    • Fundamental Analysis
    • Trading Psychology
    • Social Trading
    • Automated Trading
  • Forex Tools
    • Forex Robots
    • Forex Indicators
    • Forex Signals
  • Top Forex Brokers
  • Top Forex Robots
  • Commentary
  • Blog

© 2020, Forexezy.