ForexEzy
No Result
View All Result
  • Home
  • Getting Started with Forex
  • Forex Education
    • Forex Basics
    • Forex Trading Strategies
    • Money Management
    • Risk Management
    • Technical Analysis
    • Fundamental Analysis
    • Trading Psychology
    • Social Trading
    • Automated Trading
  • Forex Tools
    • Forex Robots
    • Forex Indicators
    • Forex Signals
  • Top Forex Brokers
  • Top Forex Robots
  • Commentary
  • Blog
No Result
View All Result
ForexEzy
No Result
View All Result
Home Forex Education Technical Analysis

How To Use RSI Indicator While Trading

by Tim Baudin
September 6, 2016
in Technical Analysis
0
How To Use RSI Indicator While Trading
0
SHARES
11
VIEWS
Share on FacebookShare on Twitter

There are several trading signals of RSI which can offer buy and sell signals. These signals are

  1. Overbought/oversold
  2. Centerline crossover
  3. Divergences

https://www.youtube.com/watch?v=sYPK2mFewS8

Overbought/Oversold:

This is the basic signal of RSI indicator. Many other leading/momentum indicators also have overbought and oversold signals. This overbought and oversold situation arise due to the presence of a range in the indicator. Different traders behave differently with these signals.

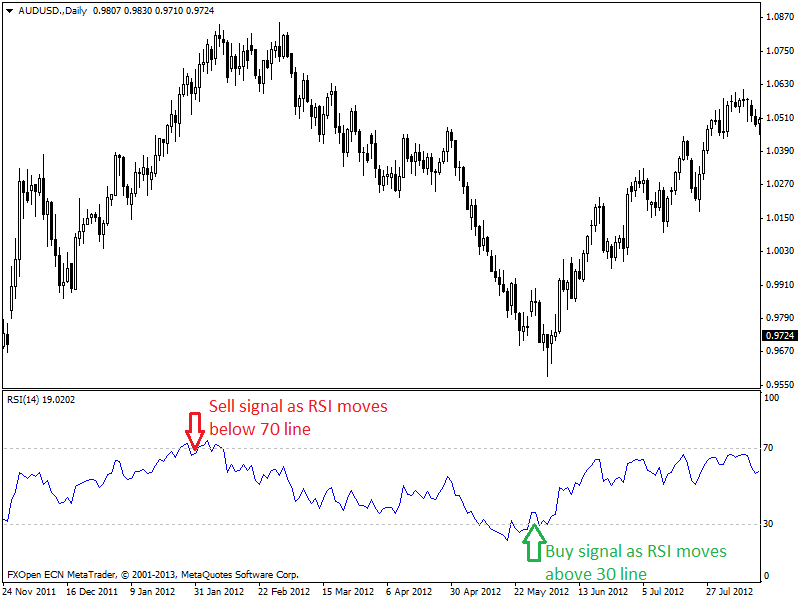
Aggressive traders take a long position as soon as RSI enters into the oversold area (below 30) and take a short position when the RSI enters into the overbought region (above 70). Defensive traders like to enter into a long position when RSI crosses above 30 line.

Inversely, they enter into a short position when the RSI crosses 70 line from above. This strategy gives better trading opportunities with less false signals than the aggressive entry. Here is an example of this strategy given below,

Overbought-Oversold

 Centerline crossover:

RSI can detect prevailing trend direction by its centerline crossover. This centerline of RSI is at 50. When RSI is above centerline or 50 line, then the trend is in the uptrend. Inversely, when RSI is below this centerline then the trend is a downtrend. Therefore, trend reversals occur when RSI crosses above and below this centerline.

If RSI crosses the centerline from below then, the trend has reversed into uptrend from the downtrend. Inversely, when RSI crosses the centerline from above, then the trend has reversed into a downtrend from the uptrend.

Here is an example chart ( a daily chart of GBP/USD) showing buy and sell signals.

Center line crossover
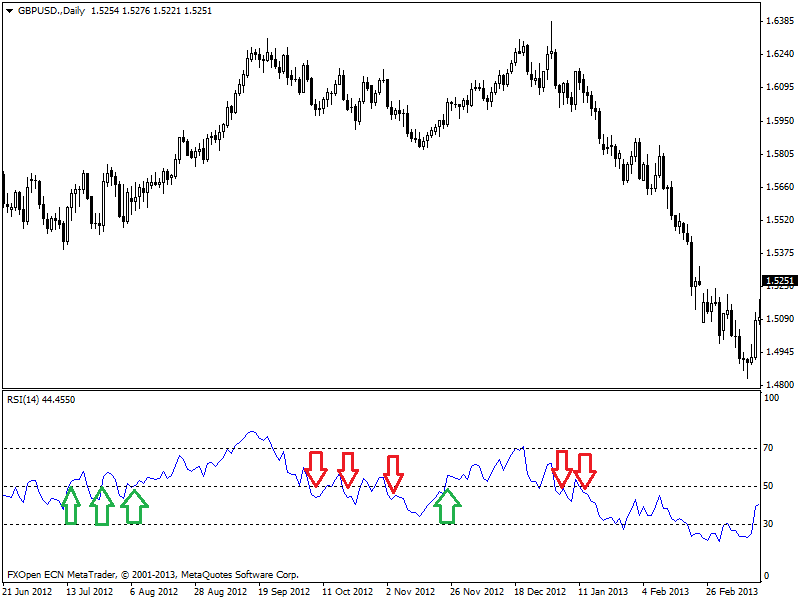
In the chart above, green colored up arrows are buy signals. A buy signal takes place whenever RSI crossed above centerline 50. Red colored down arrows are sell signals. A sell signal takes place whenever RSI crossed below centerline 50. 

Divergences:

Divergence occurs when the indicator moves against the price action at the same period. This means the price is moving in an upward direction, but the indicator is moving in the downward direction at the same time. Divergences can be found in momentum indicators or oscillators only. Because these indicators have a specified range and these indicators cannot break this limit.

Thus, when the indicator is in its extreme value due to the price fluctuations, then it starts to reverse the direction while the price is still moving in the previous direction. There are different types of divergences.

Here, we will discuss regular divergence as it is capable of identifying profitable trend reversals. Regular divergence can be bullish or bearish.

Bullish regular divergence occurs when after a long downtrend price creates Lower Low ( the current low point is lower than the previous low point) but at the same time indicator creates Higher Low ( the current low point is higher than the previous one).

This is a sign of trend reversal from downtrend to an uptrend. Therefore, we can identify uptrend reversals and can detect entry opportunities for long positions. An example of bullish regular divergence of RSI has given below,

Divergences

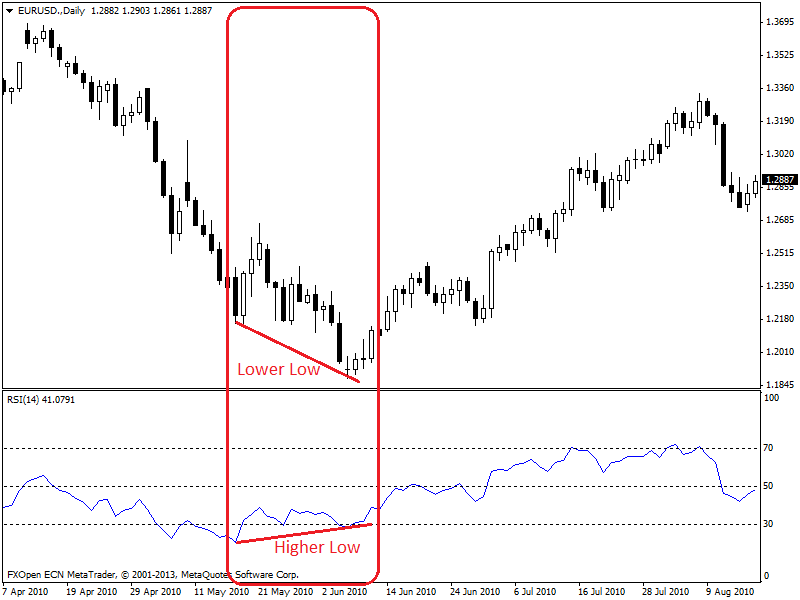
In the chart of daily EUR/USD (given above), we can see a bullish divergence after a prolonged downtrend which leads the price to uptrend reversal.

Bearish regular divergence occurs when after a long uptrend price creates Higher High ( the current high point is greater than a previous high point) but at the same time indicator creates Lower High ( the current high point is lower than the previous one).

This is a sign of trend reversal from uptrend to downtrend. Therefore, we can identify downtrend reversals and can detect entry opportunities for short positions. An example of bearish regular divergence of RSI has given below,

Bearish regular divergence

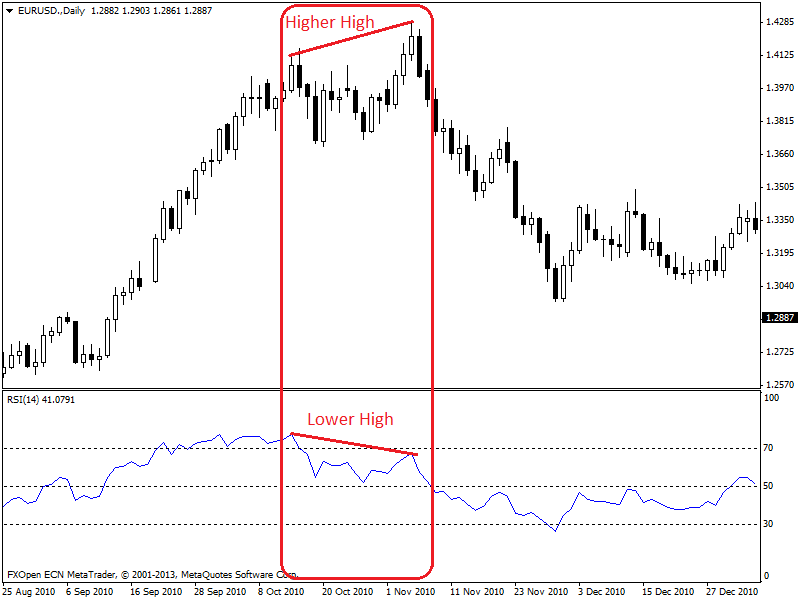
In the chart of daily EUR/USD (given above), we can see a bearish divergence after a prolonged uptrend which leads the price to downtrend reversal.

ShareTweet
Previous Post

What is Relative Strength Index (RSI Indicator) ?

Next Post

How to Use MACD Indicator Explained

Related Posts

An Introduction To Forex Momentum Indicators

An Introduction To Forex Momentum Indicators

by Tim Baudin
January 19, 2021
0

Overview There is a recurring belief in trading communities that price lies, but momentum doesn’t. The forex market is somewhat...

An Introduction To Forex Indicators

An Introduction To Forex Indicators

by Chintan Patel
January 1, 2021
0

What are the Forex indicators? A vast part of technical analysis is understanding and trading with these tools. Although they...

Using Trendlines and Saucer Formations in Trading

Using Trendlines and Saucer Formations in Trading

by Tim Baudin
December 21, 2020
0

Trendlines are those lines that you can recognize easily. A trader draws trendlines on charts in order to connect a...

RSI - Top 3 Real Charts You've Missed

RSI – Top 3 Real Charts You’ve Missed

by Tim Baudin
December 17, 2020
0

Overview Are you still doubting the power of the RSI? This article will cover three recent forex trading opportunities mostly...

The Trading Indicator You Have not Heard of – The Williams %R

The Trading Indicator You Have not Heard of – The Williams %R

by Adam Stanley
December 1, 2020
0

The Williams Percentage Range is a highly effective tool that measures price variations over a period of time for various...

Load More

Best Forex EA

  • ROFX 9/10
  • Forex Fury 8/10
  • FXgoodway 7.5/10
  • Z Trader FX EA 7/10
  • Forex Incontrol Reborn 6.5/10

Popular News

  • The Best RSI and CCI Combination Trading Strategy for Optimum Returns

    The Best RSI and CCI Combination Trading Strategy for Optimum Returns

    2 shares
    Share 2 Tweet 0
  • Rofx Review – High Profitability and Stable Performance Analysis

    29 shares
    Share 29 Tweet 0
  • The Best Forex Scalping Strategy – Using 3 Popular Technical Indicators

    0 shares
    Share 0 Tweet 0
  • The Best MT4 Indicators & Expert Advisors For Forex Trading

    2 shares
    Share 2 Tweet 0
  • How to check if the indicator is repainting?

    2 shares
    Share 2 Tweet 0

Trading

Footer

We are dedicated to demystify the world of forex trading for you – no matter what level you are on.

Categories
  • Automated Trading
  • Day Trading
  • Forex Basics
  • Forex Brokers
  • Forex Education
  • Forex Forecasts
  • Forex Indicators
  • Forex Market Commentary
  • Forex Robots
  • Forex Signals
  • Forex Tools
  • Forex Trading Strategies
  • Fundamental Analysis
  • Money Management
  • News
  • Risk Management
  • Social Trading
  • Technical Analysis
  • Top World Traders
  • Trading Psychology
  • Uncategorized
Tags
arbitrage atr bollinger bands cci chart patterns classics copy trading courses day trading forex brokers forex charts forex ea forex education forex forecasting Forex Indicators forex software reviews grid trading hedging ichimoku macd market cycles news trading oscillators price action trading rsi social trading strategies tips & tricks trading bots trading platforms trend trading Video
  • Terms of Use
  • Privacy Policy
  • Compensation Disclosure
  • Risk Disclosure
  • About Us
  • Contact Us

Copyright © 2020 by ForexEzy.com

No Result
View All Result
  • Home
  • Getting Started with Forex
  • Forex Education
    • Forex Basics
    • Forex Trading Strategies
    • Money Management
    • Risk Management
    • Technical Analysis
    • Fundamental Analysis
    • Trading Psychology
    • Social Trading
    • Automated Trading
  • Forex Tools
    • Forex Robots
    • Forex Indicators
    • Forex Signals
  • Top Forex Brokers
  • Top Forex Robots
  • Commentary
  • Blog

© 2020, Forexezy.