MACD or Moving Average Convergence Divergence is a very popular and widely used indicator in technical analysis. MACD can determine both trend direction and momentum change which has made this indicator very popular.
Most of the traders tend to trade in the short term method in the forex market.
But, institutional investors and fund managers trade in the long term. This is why long term trading is more profitable with less risk. MACD indicator is very useful for this long term trading method.
Most of the traders know about the general buy and sell signals of MACD when MACD line and signal line cross each other. But all the buy and sell signals are not that much effective as many of these signals should be avoided for a better result.
Here, we will discuss on some key factors, using these you can avoid other false signals.
Identifying Trends and Trend Reversals:
Using MACD indicator you can identify the major trend and their reversals. This is very helpful technique or trading. Most of the institutes and fund managers are focused on the major trend as they trade for long term holding. Fundamental factors also play a vital role to make long term trading very profitable.
The first thing you have to do is to identify the trend and their reversals. These major trend reversals provide the very profitable opportunity for trading. MACD can detect trend direction and trend reversal by its centerline or zero line. In this centerline, the value is zero.
Value is positive above centerline which is considered as a bullish region. The value of MACD line is negative below this centerline which is considered as a bearish region.
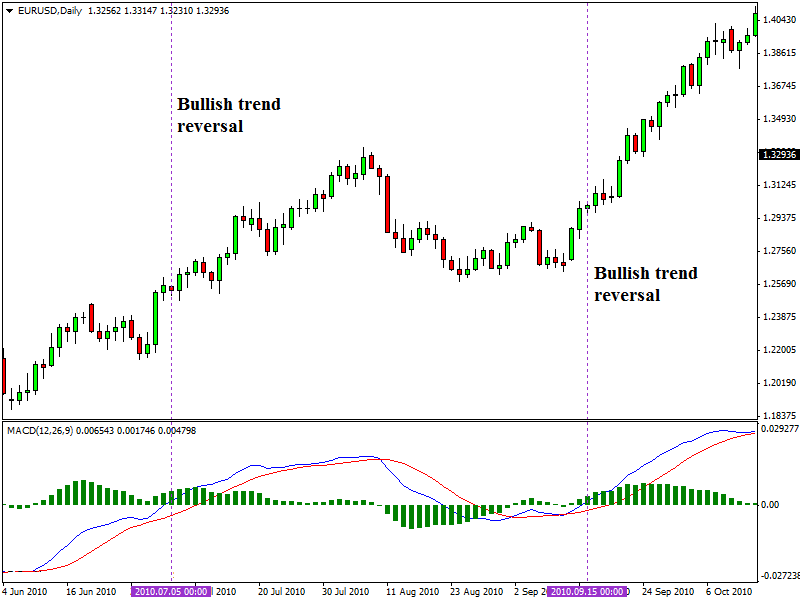
When MACD line is above this centerline, the trend is bullish, and the trend is bearish when MACD line (blue colored line) is below the centerline. When MACD line (blue colored line) crosses above this centerline then it is a bullish trend reversal and a very strong buy signal in favor of the trend.
Inversely, it is a strong sell signal or an entry signal for short position when MACD line (blue colored line) crosses below the centerline. Here is an example chart of a bullish trend reversal in the daily chart of EUR/USD (given below).

Trading in Favor of Trend:
The trend is your friend. This is an old saying which is a true fact in the case of trading in financial markets. Trading in the direction of the trend is a very profitable technique, and trading against the trend carries a high amount of risk. Successful traders tend to follow the trend direction and trade in favor of the major trend.
We have already learned to identify the trend direction and trend reversals. Now we will discuss on trading in the direction of the current trend.
MACD can generate momentum change signals which can be used in midterm or short term trading. When MACD line (blue colored line) crosses above the signal line (red colored line) then it is a bullish crossover or buy signal. Inversely, it is a bearish crossover or sell signal when blue colored MACD line crosses below the red colored signal line. These are bought and sell signals.
All of these buy and sell signals are not much effective, and some of them should be avoided during trading. If a buy signal appears below the centerline, (bearish region) then it is not in favor of a major trend. We should look for buy signals when the major trend is bullish.
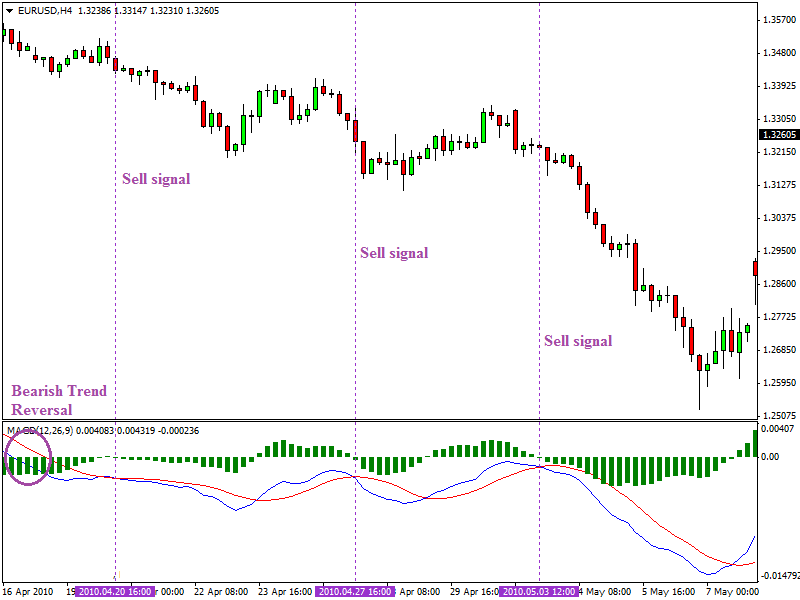
If a buy signal or bullish crossover appears when MACD line is above the centerline, then both trend and momentum are in favor to take a long position. Inversely, a favorable condition for sell signal is a bearish crossover or a sell signal appears while MACD line is below the centerline.
Here is an example of trend following trading signals for short positions (sell signals) in the 4-hour chart of EUR/USD (given below).

Summary:
MACD is a lagging indicator, so its signal has lag to some extent. For this reason, mostly, you have to enter in a position after a significant amount of change in price. Using leading indicators with MACD might help you to overcome this lag of MACD but that has disadvantages too.
MACD might not work properly in a short time frame as its focus on the major trend.


