ForexEzy
No Result
View All Result
  • Top Forex Advisors
    • Best Forex Robots
    • Best Forex Signals
    • Best Managed Accounts
  • Top Forex Brokers
    • Best Forex Brokers
    • US Forex Brokers
    • UK Forex Brokers
    • MT4 Forex Brokers
    • MT5 Forex Brokers
    • Zero Spread Brokers
    • Best PayPal Brokers
    • TradingView Brokers
    • Social Trading Platforms
  • Top Review Platforms
  • Forex Education
    • Getting Started
    • Forex Basics
    • Forex Trading Strategies
    • Money Management
    • Risk Management
    • Technical Analysis
    • Fundamental Analysis
    • Trading Psychology
    • Social Trading
    • Automated Trading
  • Forex Tools
    • Forex Robots
    • Forex Indicators
    • Forex Signals
    • Forex VPS
  • Forex Forecast
  • Crypto
    • Best Crypto Exchanges
    • Best Crypto Bots
    • Crypto Guides & Forecasts
No Result
View All Result
ForexEzy
No Result
View All Result
The World’s Leading Social Trading Platform
Try now
Home Forex Education Technical Analysis

How To Trade Ascending Scallops in Forex

by Adam Stanley
November 10, 2021
in Technical Analysis
0
How To Trade Ascending Scallops in Forex
0
SHARES
11
VIEWS
Share on FacebookShare on Twitter

Price in the Forex market does not always move in one direction. After a significant move in one direction, up or down, periods of consolidation are common. During consolidation, chart patterns develop, presenting an opportunity to either trade along with the underlying trend or bet on potential reversals.

The Best Forex Robots Report Is Already Here!
best forex robots
Check out 30+ best expert advisors with daily updated live results and statistics
Click Here

What is an Ascending Scallop?

We can see this common chart pattern that comes about when markets are trending up. The pattern appears to be in the shape of J tilted to the right after a bullish rally. A rounded bottom that forms the J-shaped pattern acts as a consolidation whereby an asset oscillates, forming small higher lows until it breaks out.

The pattern forms after the price have moved up significantly, resulting in a small pullback. The drop is usually much less and reverses back up. The reversal in line with the underlying uptrend at the start is usually not strong resulting in further pullbacks. The back and forth between pullbacks and reversals result in a wider round bottom, affirming a period of consolidation with no directional bias.

Image showing the pattern formation

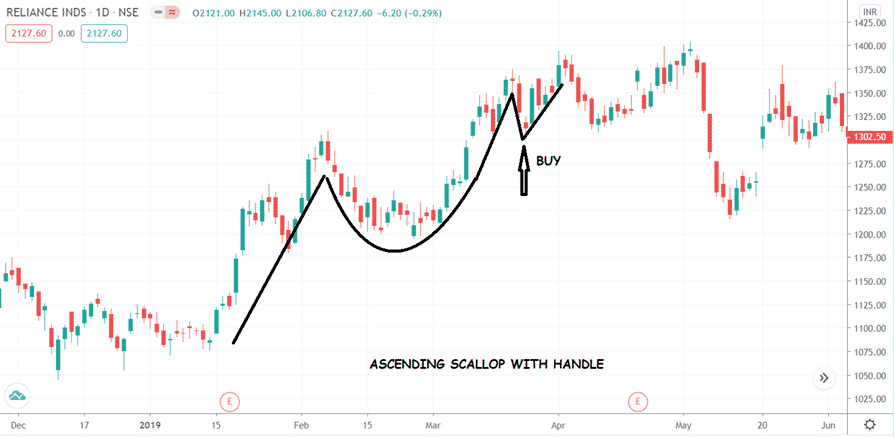
However, after the wider bottom line, a breakout to the upside comes into play resulting in the formation of higher highs from the round bottom. Once the price breaks out and rises above the previous high, a j-shaped outline emerges, as shown above.

The fact that the price has risen above the previous high, as is the case in the chart above, affirms that bulls are in control. The break out above the previous high confirms the Ascending scallop.

How to Identify Ascending scallop pattern

  • The asset should be trending up, forming higher lows.
  • A pullback should come into play after the price has moved up significantly.
  • The pullback should result in a round bottom that looks like the letter J.
  • Should be able to identify two peaks off the rounded valley.
  • A break out from the two peaks signals an upward break out.

How to trigger trades

Once the price has broken out and affirmed an uptrend, the next step entails analyzing probable entry points for the long positions. While it is not good practice to open a long position at a high, it is essential to wait for a pullback.

A small pullback makes it appropriate to open a buy position at a discount. The pullback should not dip significantly below the previous high.

Chart showing J-shape pattern formation

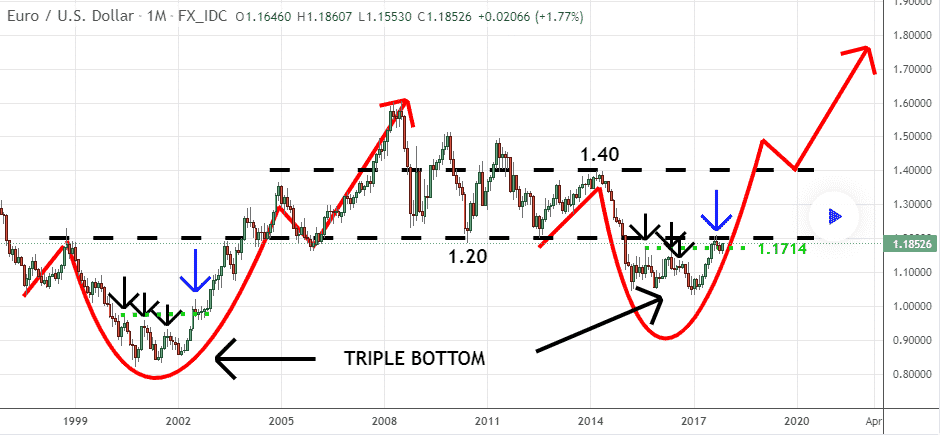
The EURUSD chart above shows the formation of an Ascending Scallop in the first phase. Following the formation of a round bottom, the price starts moving up and consequently breaks out from the rounded bottom to the upside.

Once it breaks out and rises above the 1.8526, which was the previous high, a trader can go long once it pulls back, resulting in the formation of the handle from the J pattern. Once a break-out occurs, the previous 1.8526 level becomes the immediate support.

Once the price pulls back and fails to break the 1.8526 level to edge lower, a trader can trigger a long position as it indicates further upside action in continuation of the long-term uptrend.

Setting take profit and stop-loss

A stop-loss order is essential while trying to profit from the j-shaped outline. In this case, the stop-loss order can be placed a few pips below the entry point to mitigate prospects of a correction from the uptrend and starting to edge lower.

In the case of the example above, it can be placed 10 to 20 pips below the 1.8526 support level. Price correcting and moving below the 1.8526 level would only confirm it is likely to continue edging lower back to the round bottom of the J-shaped outline.

The take profit order, on the other hand, can be calculated. In this case, subtract the price valley, the lowest point of the round bottom from the peak, from the new high created after the break. The difference is extrapolated from where the pullback ends; the point at the long trade is triggered. Its final position acts as the profit target.

Example

The chart below shows the formation of an Ascending scallop shape on the Hercules Inc. stock.

Image showing scallop configuration on Hercules Inc. stock

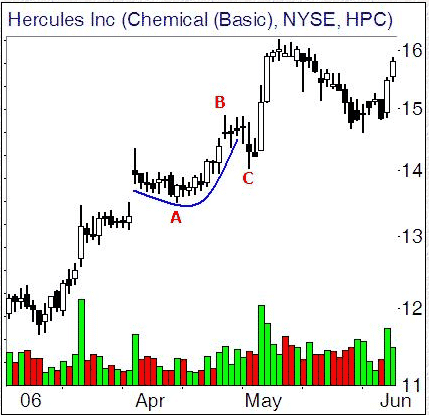
The chart above clearly shows that the J-pattern is from the round bottom at point A to point B. Once the price rose to point B, it pulled back, resulting in the formation of a handle at point C. The fact that the stock did not edge lower signifies bulls are in control and that more upside action should be expected.

In this case, one can go long from point C. The stop loss on the long position can be placed a few pips below point C. The price target, on the other hand, can be calculated by measuring the difference between point A and point B.

Following the pullback to point C, the price is expected to edge higher at the same height as point A to point B. Consequently, the height level to the upside will act as the profit target.

Early entry

While it is common for people to enter long positions once the price has broken out and pulled back to form a handle, aggressive traders also trigger long positions much earlier.

chart showing early entry on J-pattern

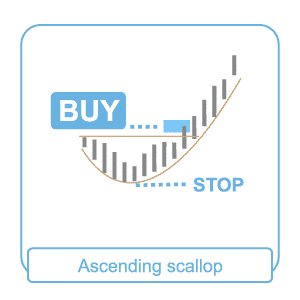
Instead of waiting for a break out to form a new high, one can open a long position as soon as the price breaks out of the round bottom as the J-pattern starts to form.

In the chart above, it is clear that a long position can be triggered slightly above the round bottom to try and profit as price tries to break out. The stop loss, in this case, is placed a few pips below the round bottom to avert the prospects of accumulating significant losses on price correcting and moving lower.

The Best Forex Robots Report Is Already Here!
best forex robots
Check out 30+ best expert advisors with daily updated live results and statistics
Click Here
ShareTweet
Previous Post

Forex.com Review

Next Post

Stenvall Mark III Robot Review

Related Posts

Trading With Balance of Power Indicator

Trading With Balance of Power Indicator

by Adam Stanley
December 9, 2021
0

The Balance of Power (BOP) indicator is an analysis tool created by Igor Livshin in August 2001. It tracks the...

What Are Pennant Chart Patterns in Forex: Step by Step Guide

What Are Pennant Chart Patterns in Forex: Step by Step Guide

by Chintan Patel
November 15, 2021
0

Continuation patterns in the forex market are a common occurrence whenever there is a large movement in one direction followed...

Inverted Scallops in Forex Chart Patterns: Step by Step Guide

Inverted Scallops in Forex Chart Patterns: Step by Step Guide

by Adam Stanley
November 9, 2021
0

Whenever prices move up significantly in the forex market, exhaustion often kicks in. In most cases, the fatigue is usually...

Elder’s Method in Forex Trading

Elder’s Method in Forex Trading

by Tim Baudin
November 3, 2021
0

There are several strategies that traders and analysts have developed over the years, all in a bid to milk the...

Trading With Spinning Tops and Doji Candlestick Pattern

Trading With Spinning Tops and Doji Candlestick Pattern

by Tim Baudin
October 29, 2021
0

Japanese candlestick formations go hand-in-hand with various concepts related to chart analysis. Candlestick charts are popular among most of the...

Load More

Leave a Reply Cancel reply

Your email address will not be published. Required fields are marked *

Best Forex Automated Systems

  • TechBerry 9/10
  • Happy Galaxy 8.5/10
  • Forex Cyborg 8.5/10
  • Forex Fury 8/10
  • FXgoodway 7.5/10
  • Best Forex Brokers
  • Best Forex Robots
  • Best Forex Signals
  • Best Forex Managed Accounts

Top Trading Markets

We are dedicated to demystify the world of forex trading for you – no matter what level you are on.

Categories
  • Automated Trading
  • Crypto Robot Review
  • Cryptocurrency Trading
  • Day Trading
  • Forex Basics
  • Forex Brokers
  • Forex Education
  • Forex Forecasts
  • Forex Indicators
  • Forex Market Commentary
  • Forex Robots
  • Forex Signals
  • Forex Signals
  • Forex Tools
  • Forex Trading Strategies
  • Forex VPS
  • Fundamental Analysis
  • Managed Accounts
  • Money Management
  • News
  • Review
  • Review Platforms
  • Risk Management
  • Social Trading
  • Technical Analysis
  • Top World Traders
  • Trading Apps
  • Trading Psychology
  • Uncategorized
Tags
Acquisition AI Amazon Apple Artificial Intelligence Bitcoin bond yields CEO China earnings earnings report economy Electric Vehicles Federal Reserve financial performance Financial Results forex ea forex software reviews Growth Guidance Housing Market inflation interest rates Investing investment Investors Market Volatility merger mortgage rates net profit Nvidia Oil prices Q2 Results revenue Revenue Growth Sales sales growth Stock Futures stock market stock performance Stocks strategies technology Tesla Video
  • Terms of Use
  • Privacy Policy
  • Compensation Disclosure
  • Risk Disclosure
  • About Us
  • Contact Us

Copyright © 2023 by ForexEzy.com

No Result
View All Result
  • Top Forex Advisors
    • Best Forex Robots
    • Best Forex Signals
    • Best Managed Accounts
  • Top Forex Brokers
    • Best Forex Brokers
    • US Forex Brokers
    • UK Forex Brokers
    • MT4 Forex Brokers
    • MT5 Forex Brokers
    • Zero Spread Brokers
    • Best PayPal Brokers
    • TradingView Brokers
    • Social Trading Platforms
  • Top Review Platforms
  • Forex Education
    • Getting Started
    • Forex Basics
    • Forex Trading Strategies
    • Money Management
    • Risk Management
    • Technical Analysis
    • Fundamental Analysis
    • Trading Psychology
    • Social Trading
    • Automated Trading
  • Forex Tools
    • Forex Robots
    • Forex Indicators
    • Forex Signals
    • Forex VPS
  • Forex Forecast
  • Crypto
    • Best Crypto Exchanges
    • Best Crypto Bots
    • Crypto Guides & Forecasts

© 2023, Forexezy. {copy} {year}