Japanese candlestick formations go hand-in-hand with various concepts related to chart analysis. Candlestick charts are popular among most of the traders that analyze currency pairs and other instruments. There are plenty of candlestick setups, varying in nature and proceeding moves. Spinning tops and Doji belong to the group of setups that we can see in the Japanese charts.
In the illustration below, we can see the change of trend’s direction that started from the pattern.
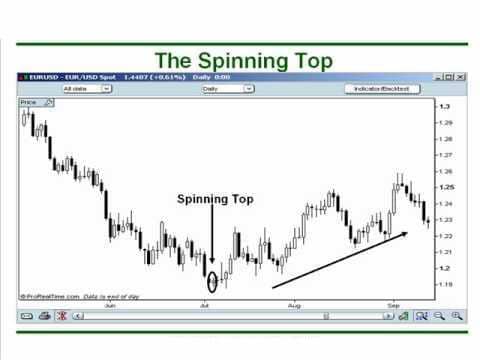
In general, these are neutral formations that indicate indecision between buyer and seller.
What are indecision candles in forex?
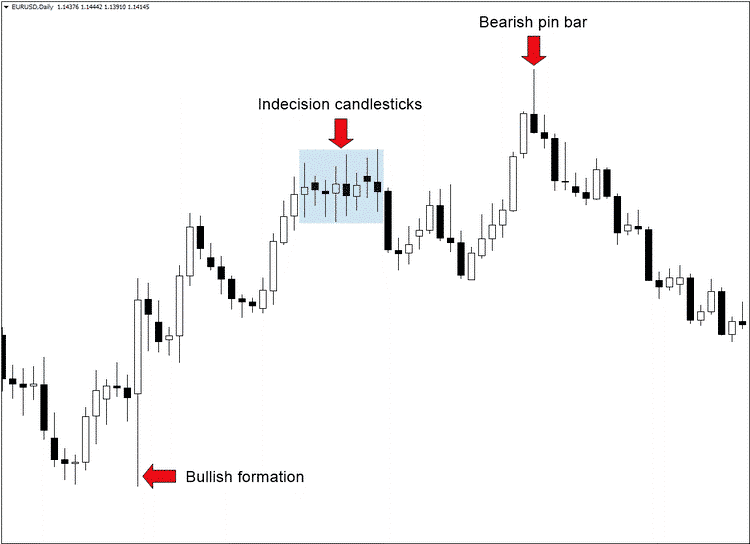
Indecision candles are candlesticks that don’t have any directional bias. In this case, they don’t provide any valuable or additional information on the direction price is likely to move. They often occur during periods of consolidation whereby both buyers and bears are trying to push the price in either direction but with no success.
Periods of balance between the volume of purchases and sales are what triggers indecision as price struggles to move in either direction. However, the patterns that come about after indecision candlesticks can provide valuable hints on the direction price is likely to move after consolidation (see the examples below).
Indecision candles are characterized by small bodies and long wicks that signal buyers have tried to push the price up but experienced resistance from sellers. Similarly, they also show sellers tried to push prices lower but faced strong opposition from buyers resulting in price closing where or near where it opened.
The indecision comes about given that buyers and sellers try to push prices up and down, respectively, but to no avail. The balance between buying and selling pressure results in indecision, causing the opening and closing price to be the same.
The neutrality that arises due to balanced buying and selling pressure often results in consolidation, resulting in price trading in a tight range without any directional bias.
What is the Spinning Top candlestick?
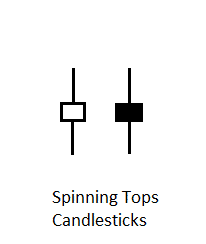
The pattern’s open and close are not remote from each other, so the body is small. On the contrary, the extreme prices are far; thus, there are long wicks. This setup represents the indecision between buyers and sellers. Near or equal upper and lower wick represents the equal amount of buying and selling pressure.
Here is a figure showing the shape of spinning tops candlestick patterns.
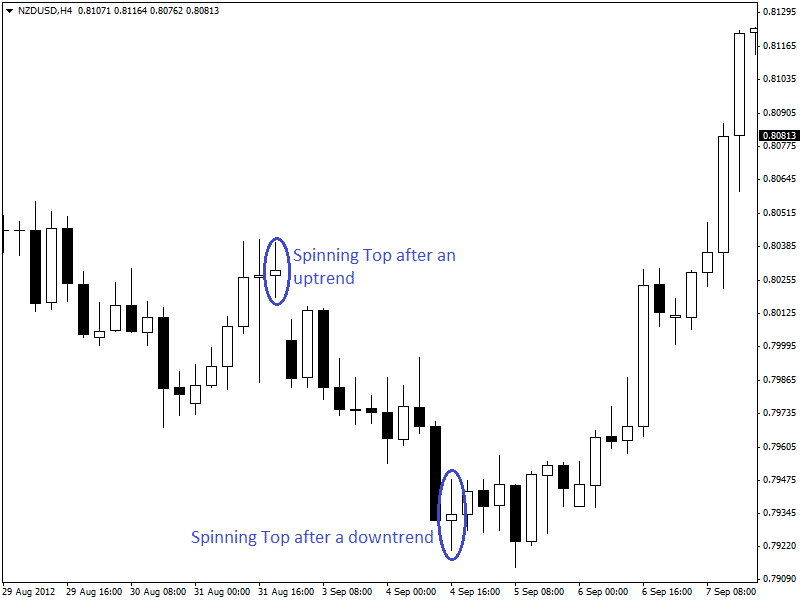
The spinning top technical analysis can identify possible trend reversal if found after a significant or prolonged trend. For example, if spinning top forex candlesticks are found at the top of a prolonged uptrend, this indicates a possible bearish reversal.
The pattern works in the same way whether you trade forex or stocks.
Spinning top stock candle after a prolonged downtrend indicates a possible upward or bullish reversal. The same goes for the forex market.
Here is an example chart of reversals due to spinning top candle patterns shown on the 4-hour chart of NZDUSD.
In the case of trading, this candlestick pattern should be combined with other indicators or charting tools.
Trendlines and chart patterns work very well with candlestick patterns. Spinning top forex candlestick patterns combined with chart patterns or trendlines is a very effective price action-based trading strategy.
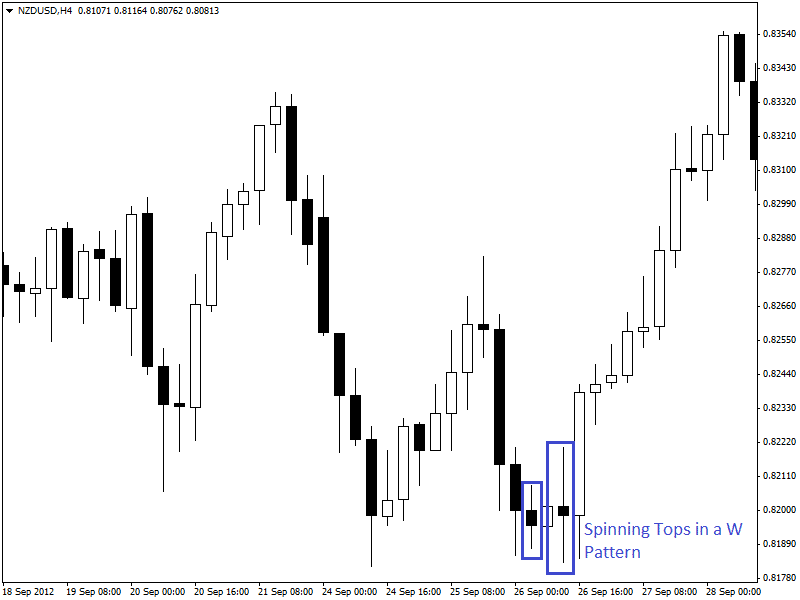
The 4-hour chart of NZDUSD (given above) shows spinning top candlestick patterns are found in a W pattern. The spinning top pattern indicates a strong possibility of reversal here, with the help of the W pattern. Other chart patterns like M pattern or head and shoulders patterns are also effective for this type of trading approach.
Top indecision candles setups for continuation and reversal trades
There are two variations of the spinning top candlesticks depending on whether they appeared after a downtrend or uptrend. Although spinning top patterns are considered to indicate indecision, that’s what often happens when the market is about to reverse.
The indecision becomes more significant when the price forms at least 2 spinning top candles in a row. Often after the market breaks out from such long consolidations, we can see a strong impulse move in either direction.
Spinning top bullish setup
We can see the setup at the lower end of a downtrend (see the example below). It is characterized by price edging lower but gets rejected amid building buying pressure. The result is price retracing and closing near the opening price.
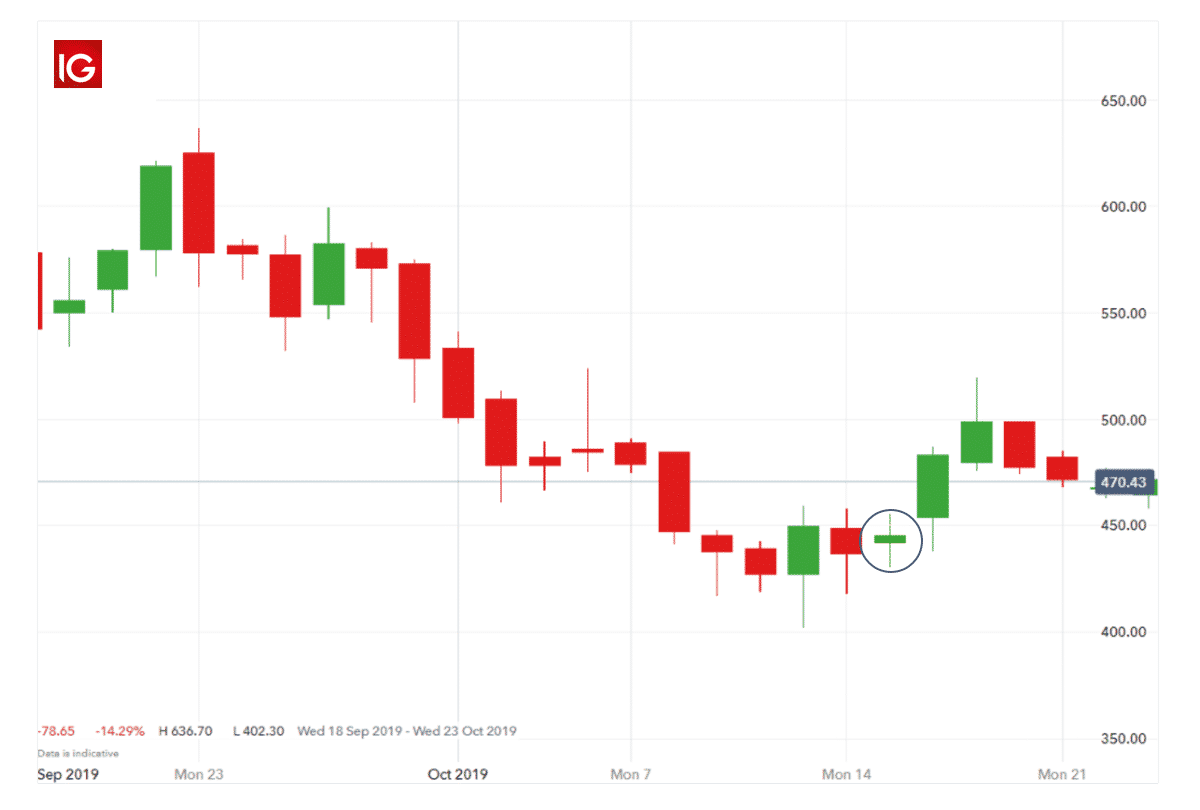
When the candlestick comes up at the lower end of a downtrend, it signals to wane bearish pressure, implying the price is likely to correct higher. A confirmation that the price has reversed and is likely to continue moving up comes in the form of a big bullish candlestick immediately after the indecision sipping candle at the base of the downtrend.
Spinning top bearish setup
A spinning top occurs at the top of an uptrend after the price has moved up significantly. It is characterized by a price trying to edge higher but gets rejected only to retreat and close near the opening price. The long wick to the upside implies buyers faced strong resistance from sellers, which results in price correcting lower.
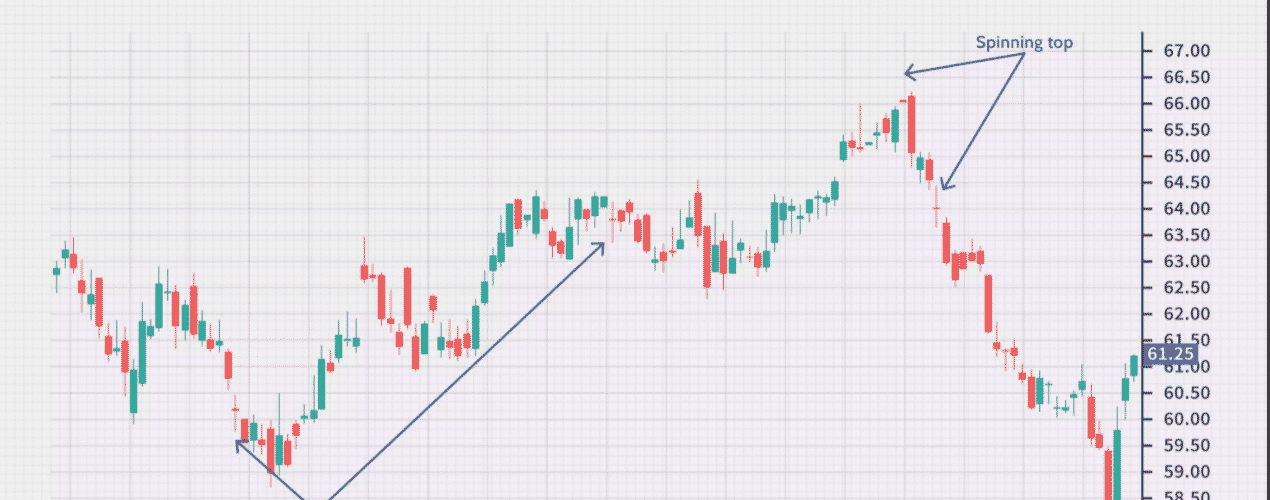
Confirmation that price has reversed and is likely to start moving lower comes in the form of a big bearish candle immediately after the spinning top candlestick, as shown above.
Doji
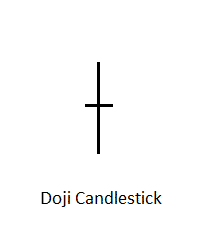
Here is another neutral candlestick pattern that indicates indecision between buyers and sellers. This pattern is similar to the spinning top candlestick pattern. This pattern has long upper and lower shadows like spinning top candles.
But the open and close prices of this pattern are virtually equal. Very little or no real body is seen in this candlestick. Here is an example of this candlestick pattern.
Spinning top Doji is an important neutral candlestick that is often used as a reversal candlestick pattern in some cases. This pattern is useful if combined properly with trendlines or chart patterns. This candlestick pattern can play an important role in any price action-based trading strategy.
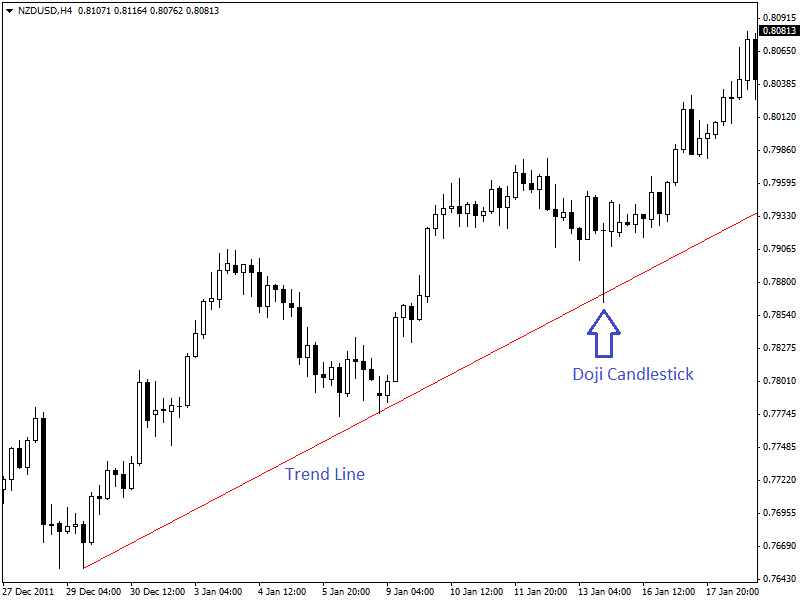
The 4-hour chart of NZDUSD (given above) is showing the effect of Doji forex candlestick in finding reversals. In the chart above, a reversal has occurred as soon as a Doji candle has hit the trendline. This trendline is heading upward, indicating the presence of an uptrend and a possibility of pullback or getting support from this trendline.
At this time, a Doji forex candlestick near this trendline after a downfall has confirmed a possible pullback. A strong bullish candle after the Doji candle has provided more confirmation.
Trading forex using candlesticks only is not so easy. This requires a high level of knowledge, patience, and experience to trade with simple charts. If you find it difficult to trade with candlesticks only, then you better add other suitable tools with candlestick patterns.
How to trade Doji
Doji bullish setup
You can often see Doji bullish setup when the downtrend ends. In this case, it implies waning short-selling momentum. Consequently, it acts as a warning sign that prices are likely to correct and start moving up.
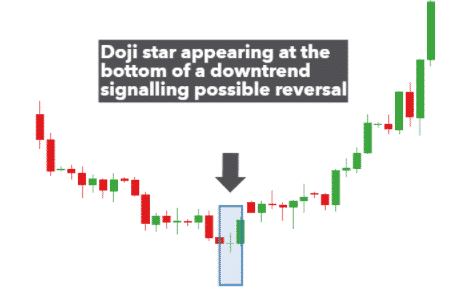
In the chart above, it is clear that the price moved up as soon as a big bullish candle happened immediately after the Doji appeared, implying upward building momentum.
Doji bearish setup
The Doji bearish setup is characterized by a Doji candle occurring at the top of an uptrend signaling waning upward momentum (see the illustration below). Failure of bulls to push prices higher implies bears are increasingly flocking the market.
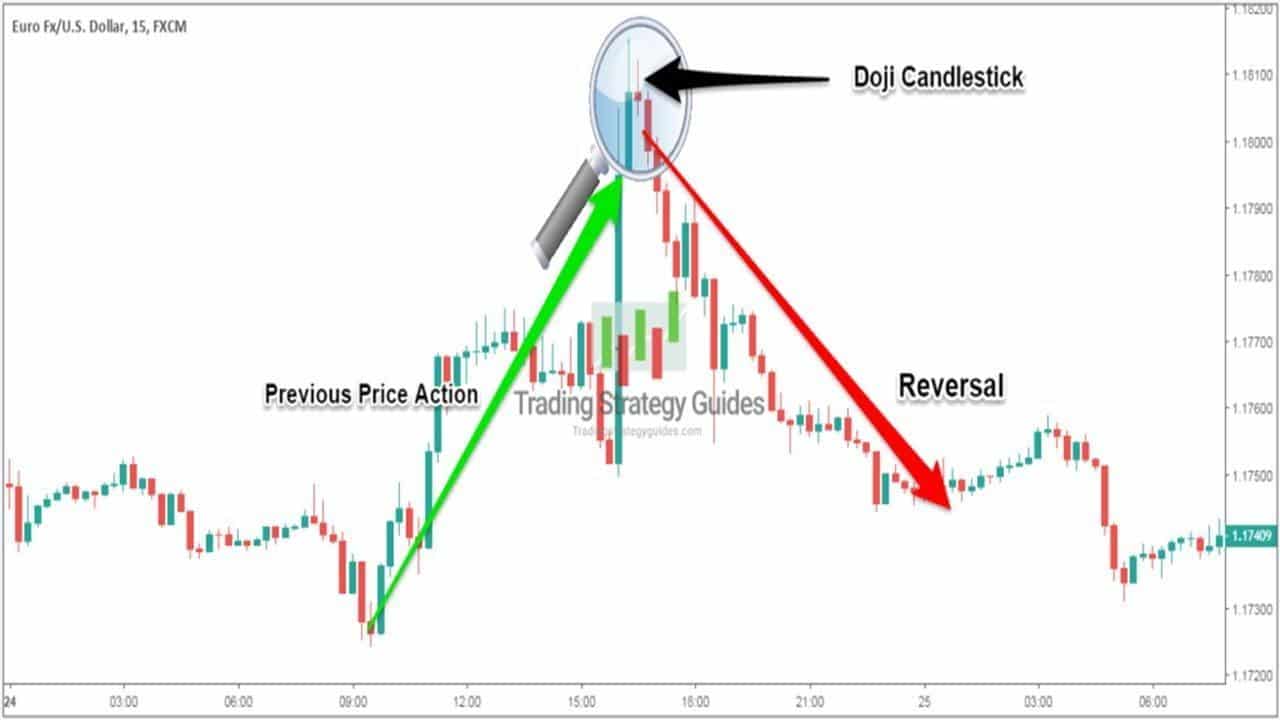
A build-up in selling pressure often results in a big bearish candle immediately after the Doji candle at the top of an uptrend that affirms the start of a downtrend.
Indecision candle types
Dragonfly Doji
Dragonfly Doji is a special type of indecision candlestick that happens when the open, the highest, and closing prices are the same. The candlestick comes with a long wick to the downside. The long wick signals sellers tried to push price lower, but buyers came back and steered price higher back to the opening price.
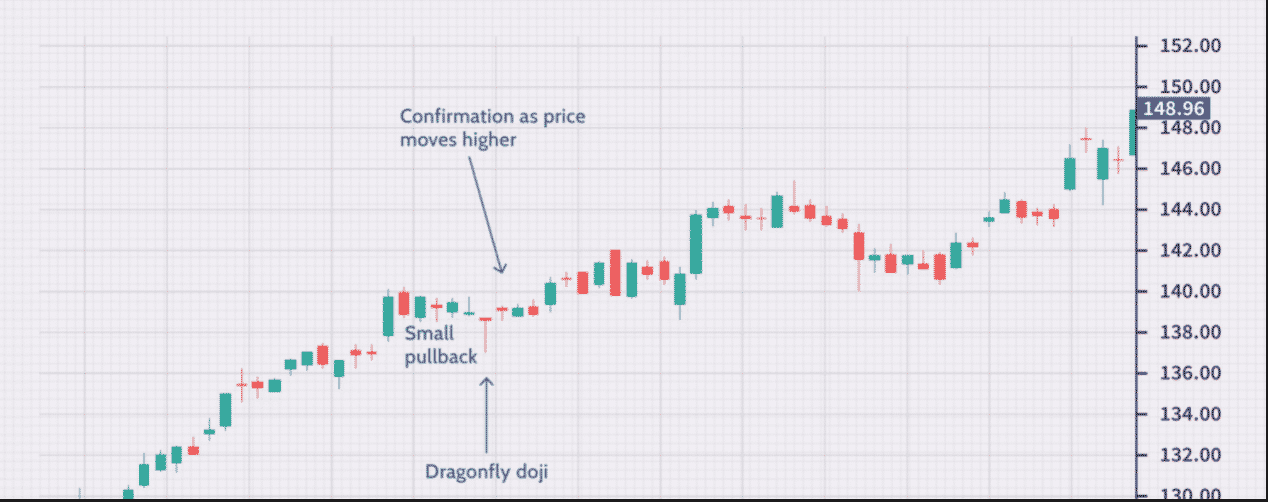
The price closes near the opening price showing buyers were able to absorb the selling pressure. Depending on where the candlestick happens, it could signal price reversal to the downside or upside depending on the underlying trend (see the example above).
In case of a downtrend, the occurrence of a dragonfly Doji could signal a potential price rise. In case of an uptrend, the candlestick could signal building selling pressure that could result in price edging lower.
Gravestone Doji
A gravestone Doji is an indecision candlestick characterized by the opening, low, and closing price all being near each other.
Contrary to the hammer top candle that has a visible body, the gravestone Doji comes with a long wick to the upside and a tiny body or wick. The long wick to the upside suggests that buyers tried to push prices higher but experienced strong resistance from sellers resulting in prices pulling back to where they nearly opened.
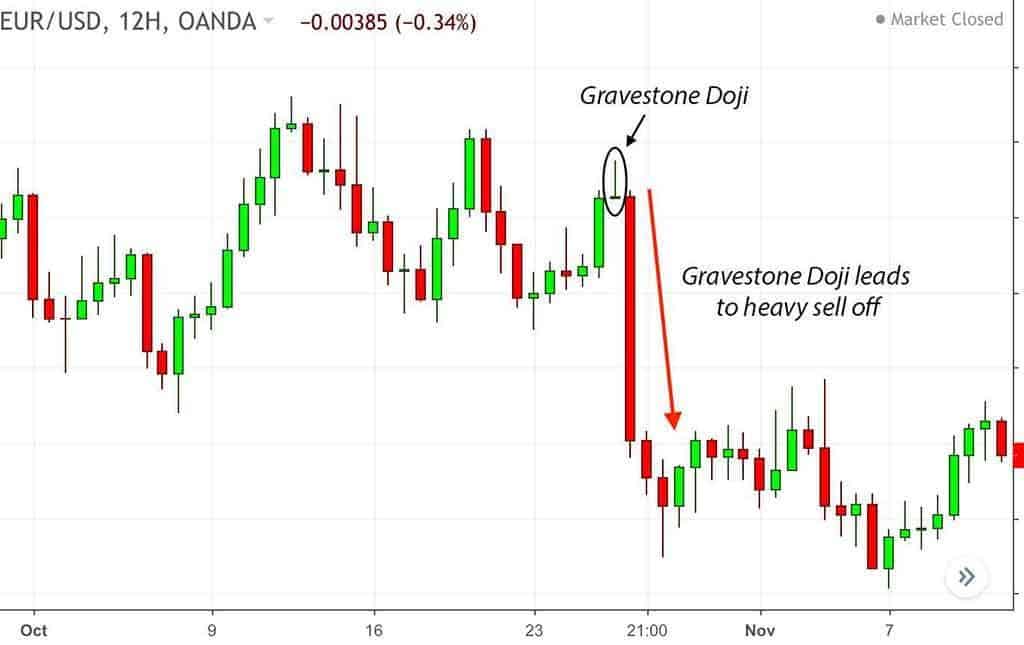
When the candlestick happens, in most cases, it suggests the start of bearish reversal (like in the chart above) as buyers face strong resistance from short sellers. The long wick to the upside suggests waning bullish momentum. While the candlestick can be found at the end of a downtrend in most cases, it occurs at the end of an uptrend, signaling trend reversal.
Morning Doji star
A morning Doji star is a candlestick made up of three candlesticks. It consists of one long bearish candle followed by a Doji and a bullish candle.
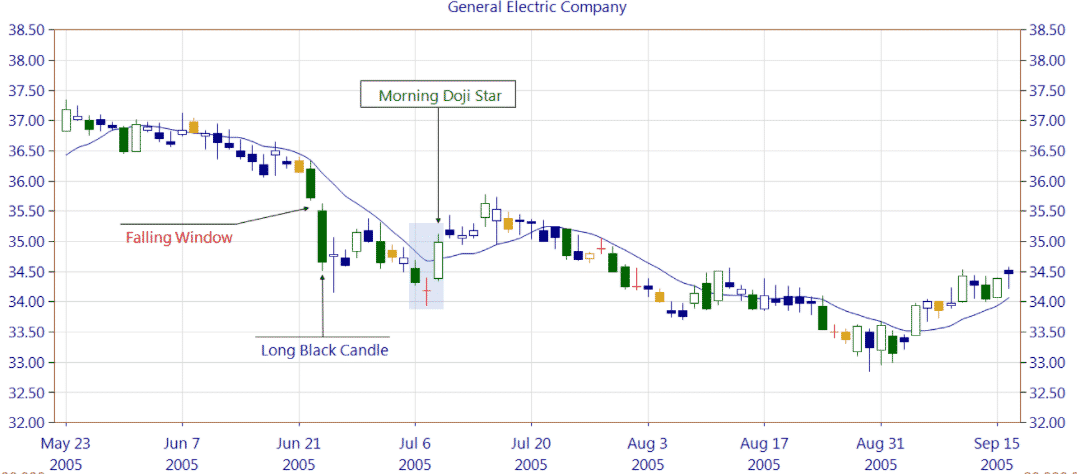
When the pattern occurs after the price has significantly moved lower, it acts as a warning sign of a potential price reversal. The formation of a Doji implies waning bearish momentum, which is confirmed by a strong bullish candlestick. In most cases, prices often reverse from the downtrend and start moving up, as is the case in the chart above.
Bullish Harami cross
A bullish Harami cross pattern occurs in a downtrend and signals a trend is about to reverse amid waning short-selling pressure. The pattern consists of three candlesticks (see the image below).
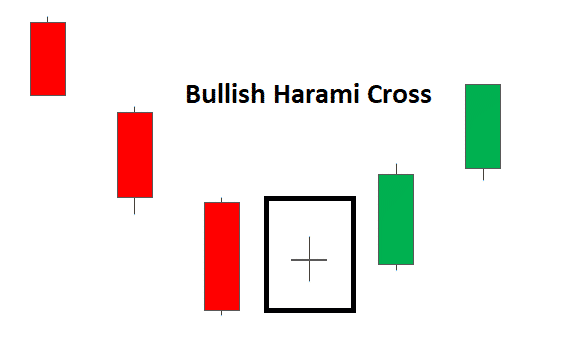
The first is usually a long bearish candle signaling downward pressure. However, it is immediately followed by a Doji as if it signals a balance between buyers and sellers. When the Doji happens, it implies selling pressure is waning, which is only confirmed with the emergence of a third bullish candle that signal trend has reversed.
Spinning top vs. Doji: the main difference
Doji and spinning top are two of the most popular indecision formations that indicate a fierce battle between buyers and sellers. While both signal a balance between buyers and sellers, they also differ a great deal.
Doji candles come out as crosses or plus signs, depending on the length of the wicks. The narrow body is what differentiates them from the spinning top pattern as it indicates the opening and closing prices are the same or very nearly the same.
While the Doji signals neutrality, it might also signal a reversal in buying momentum when it appears gapped above a previous bull candle. Likewise, it could signal a reversal of the downtrend when it appears above a previous bear candle.
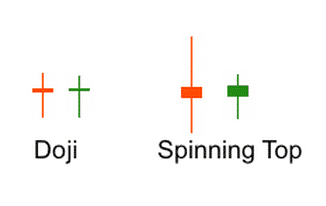
While spinning top candlesticks also signal a balance in the market, they differ from Doji in having a slightly bigger body (see the comparison image above). The big body signals the difference between opening and closing price. The long wicks on either side signal a big difference in the high and low.
A spinning top candle often provides early warning signs that the underlying trend is losing momentum. However, it does not necessarily imply reversal.
Is a spinning top bullish or bearish?
Spinning top forex candles is neither bullish nor bearish on its own. The fact that the opening and closing prices are close signals indecision in the market. The small difference implies buyers tried to steer prices higher but struggled as sellers came into the fold, pushing prices lower, thus resulting in a big wick on top of the body.
Similarly, sellers also tried to push prices lower but failed, resulting in prices bouncing back only to close near the opening price with a big wick to the downside.
A spinning top can only signal a potential price reversal if the candle that follows signals the same. For instance, if a big bear candle follows a bearish spinning top candle, the same would signal price has corrected from an uptrend and is likely to move lower.
Additionally, if a big engulfing bullish candle follows a bullish spinning top, the same could imply price has reversed from a downtrend and is likely to start moving up.


