ForexEzy
No Result
View All Result
  • Top Forex Advisors
    • Best Forex Robots
    • Best Forex Signals
    • Best Managed Accounts
  • Top Forex Brokers
    • Best Forex Brokers
    • US Forex Brokers
    • UK Forex Brokers
    • MT4 Forex Brokers
    • MT5 Forex Brokers
    • Zero Spread Brokers
    • Best PayPal Brokers
    • TradingView Brokers
    • Social Trading Platforms
  • Top Review Platforms
  • Forex Education
    • Getting Started
    • Forex Basics
    • Forex Trading Strategies
    • Money Management
    • Risk Management
    • Technical Analysis
    • Fundamental Analysis
    • Trading Psychology
    • Social Trading
    • Automated Trading
  • Forex Tools
    • Forex Robots
    • Forex Indicators
    • Forex Signals
    • Forex VPS
  • Forex Forecast
  • Crypto
    • Best Crypto Exchanges
    • Best Crypto Bots
    • Crypto Guides & Forecasts
No Result
View All Result
ForexEzy
No Result
View All Result
The World’s Leading Social Trading Platform
Try now
Home Forex Education Technical Analysis

Elder’s Method in Forex Trading

by Tim Baudin
November 3, 2021
in Technical Analysis
0
Elder’s Method in Forex Trading
0
SHARES
11
VIEWS
Share on FacebookShare on Twitter

There are several strategies that traders and analysts have developed over the years, all in a bid to milk the forex market for profit. The Elder’s method, also referred to as the triple screen strategy, is one such strategy. It was developed by Dr. Alexander Elder, a psychiatrist, and professor. It was based on his hypothesis that no one indicator can produce accurate signals as a standalone entity. To remedy this, he came up with a method involving multiple timeframe analyses and a combination of several indicators.

The Best Forex Robots Report Is Already Here!
best forex robots
Check out 30+ best expert advisors with daily updated live results and statistics
Click Here

How it works

Dr. Elder meant for his method to be used in three time frames. The first was a higher timeframe, which is used to determine the prevailing market trend. Ergo, the chart on this timeframe should be used with trend following indicators. This provides a trading bias. 

The second timeframe is a medium-term timeframe, which is used for identifying opportune areas for trading. Here, we use overbought and oversold indicators to identify retracements or pullback areas. Once these areas are identified, you need to be on the lookout for opportune entry signals. 

The third chart is set to the actual trading timeframe. As a rule of thumb, each of the three charts is supposed to be at least 5 times shorter than its predecessor. This final chart is where you spot trade entry and exit signals. It is not uncommon to see traders relying on instinct at this step. However, you may use indicators to help you with signal generation. 

When using Elder’s method, long-term traders may use a weekly timeframe for their first screen, daily for their second, and a 4-hour chart for their third screen. For medium-term traders, a daily chart would be appropriate for the first screen, a 4-hour chart for the middle screen, and the 1-hour chart for the third screen. For scalpers they may choose the 4-hour chart for trade bias identification, the 1-hour chart for spotting pullbacks and retracements, and a 15-minute chart for generating entry and exit signals.   

First screen

As aforementioned, the first screen is set to the highest timeframe. This helps establish the prevalent market trend. In the forex market, you’re always better off trading in the direction of the trend. 

For this, you may use trend-following indicators such as Moving Averages. Let’s try the three screens method to trade EURUSD. The idea is to identify whether the pair is in an uptrend or downtrend. If it is on a rally, we will be looking to enter long trends. If its price is in a downtrend, we’ll be looking for short trades. 

For our first chart, we will be analyzing the weekly chart. To identify the dominant trend, we’ll utilize the MACD with regular settings and a 13-period Exponential Moving Average. A downtrend will be identified by prices trending below the Moving Average and the MACD histogram trending below the zero line. An uptrend will be the opposite – prices above the EMA and the MACD histogram reading above zero.

First screen, EURUSD weekly chart with MACD and EMA.

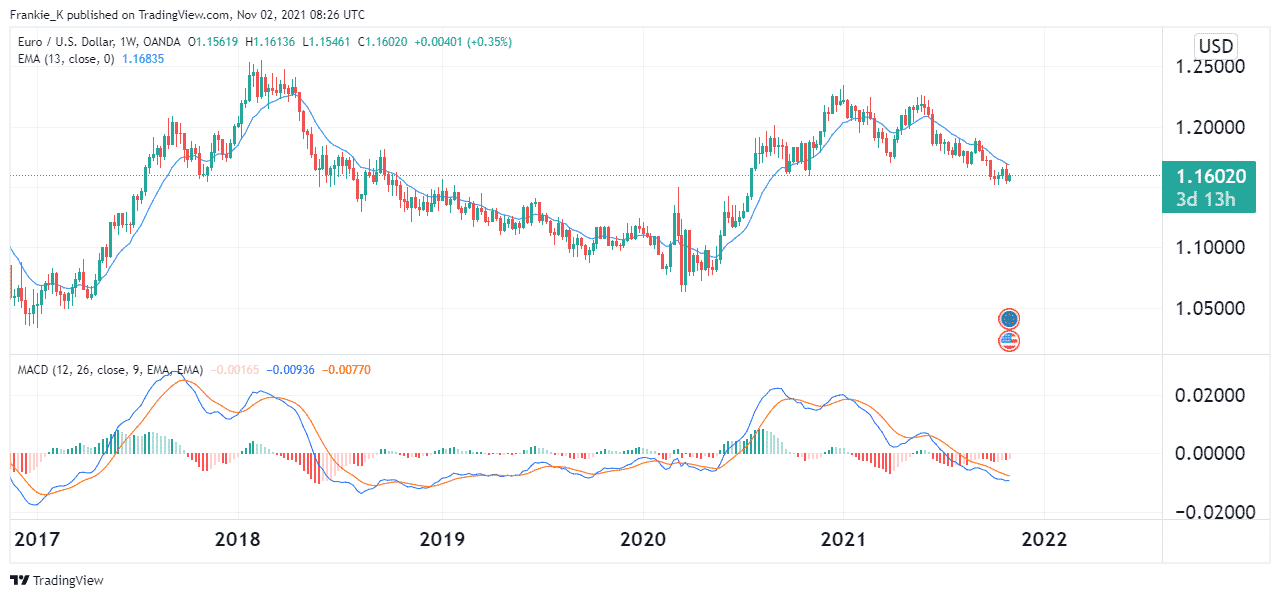
From the chart above, we can see that EURUSD prices were in a downtrend for most of 2021. Therefore, we will be looking to enter short trades.

Second screen

Now we know we’re looking for short trades. We will switch to the second screen to identify an area where the prevalent trend has experienced a short reversal or some sort of dead cat bounce. This break from the trend would indicate that prices will soon resume their original trend, which is what we’re looking to trade. 

For our example, we will use the stochastic oscillator to identify when prices leave overbought levels. If we were trading an uptrend, we would be looking for stochastics leaving oversold levels. You may also choose to use other oscillators, such as the Relative Strength Index.

Stochastics showing overbought conditions on the daily chart.

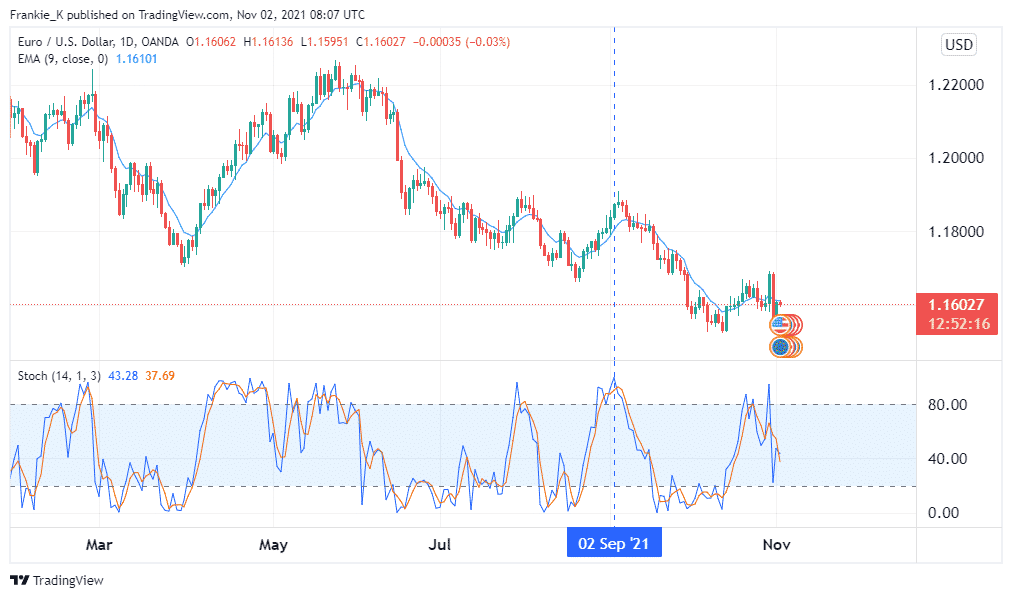
The chart above shows the stochastic indicator leaving overbought levels at the beginning of September. This tells us we should be looking for entry signals around this date.

Third screen

At this stage, we don’t have to rely on indicators to identify entry signals. We can just use the naked eye to identify when a short-term reversal from the original trend ends. For this, we use the 4-hour EURUSD chart. 

Since we’re looking to enter a short trade, once we identify the return to the original trend, we can choose to use a trailing buy stop one point below the previous candlestick’s low. This ensures that we only enter the trade once our prediction has been confirmed. The stop-loss should be placed above the dead cat bounce’s swing high so that it is only triggered if the uptrend holds instead. 

Take-profit levels can be placed at twice the distance of the stop loss for a 1:2 risk to reward ratio or farther. Some traders opt to use trailing stop-losses once they break even so that they can ride the trend and exit the trade manually when it finally reverses.    

EURUSD 4-hour chart giving entry signals.

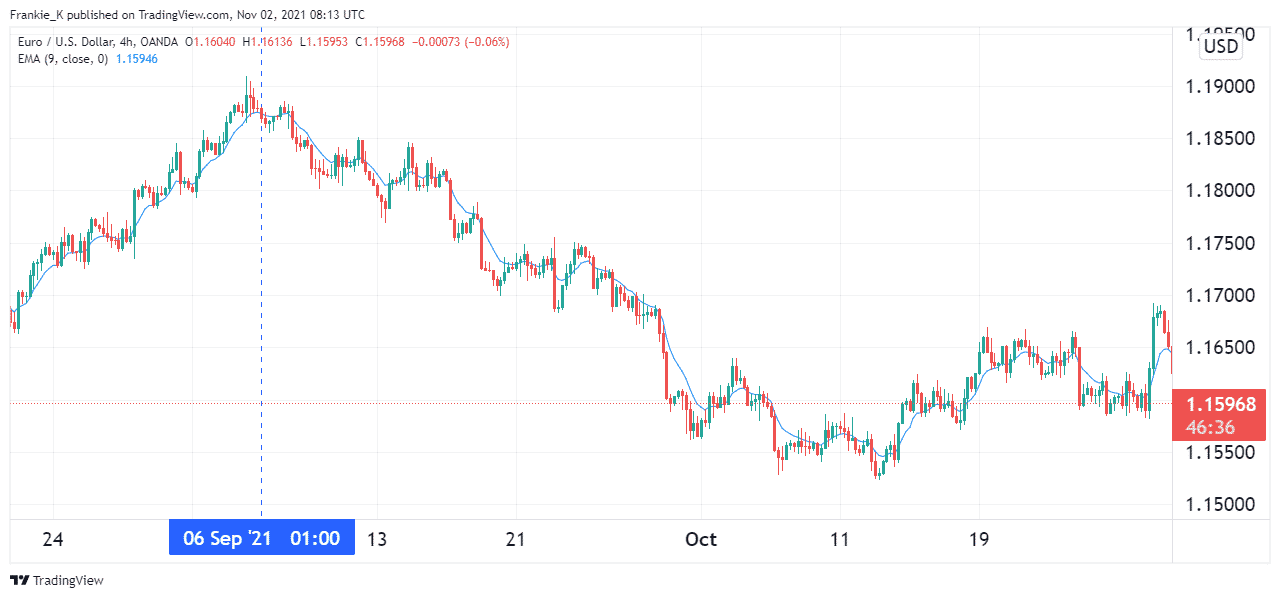
From the chart above, we can see prices return to the prevailing downtrend around the 6th of September. This gave our entry signal. The exit signal came a month later when the downtrend ended in a short consolidation in October.

Conclusion

Dr. Alexander Elder was convinced that no one indicator could produce accurate signals. Therefore, he came up with a strategy that utilizes multiple timeframes and several indicators in the analysis process. This strategy is named the Elder Method. This method utilizes trend following indicators on a large timeframe, oscillators on an intermediate timeframe, and pure observation on a short timeframe. A trader following this strategy has the advantage of trading in line with the trend. 

The Best Forex Robots Report Is Already Here!
best forex robots
Check out 30+ best expert advisors with daily updated live results and statistics
Click Here
ShareTweet
Previous Post

Types of Risks in Forex

Next Post

What Is a Lot Size in Forex?

Related Posts

Trading With Balance of Power Indicator

Trading With Balance of Power Indicator

by Adam Stanley
December 9, 2021
0

The Balance of Power (BOP) indicator is an analysis tool created by Igor Livshin in August 2001. It tracks the...

What Are Pennant Chart Patterns in Forex: Step by Step Guide

What Are Pennant Chart Patterns in Forex: Step by Step Guide

by Chintan Patel
November 15, 2021
0

Continuation patterns in the forex market are a common occurrence whenever there is a large movement in one direction followed...

How To Trade Ascending Scallops in Forex

How To Trade Ascending Scallops in Forex

by Adam Stanley
November 10, 2021
0

Price in the Forex market does not always move in one direction. After a significant move in one direction, up...

Inverted Scallops in Forex Chart Patterns: Step by Step Guide

Inverted Scallops in Forex Chart Patterns: Step by Step Guide

by Adam Stanley
November 9, 2021
0

Whenever prices move up significantly in the forex market, exhaustion often kicks in. In most cases, the fatigue is usually...

Trading With Spinning Tops and Doji Candlestick Pattern

Trading With Spinning Tops and Doji Candlestick Pattern

by Tim Baudin
October 29, 2021
0

Japanese candlestick formations go hand-in-hand with various concepts related to chart analysis. Candlestick charts are popular among most of the...

Load More

Leave a Reply Cancel reply

Your email address will not be published. Required fields are marked *

Best Forex Automated Systems

  • TechBerry 9/10
  • Happy Galaxy 8.5/10
  • Forex Cyborg 8.5/10
  • Forex Fury 8/10
  • FXgoodway 7.5/10
  • Best Forex Brokers
  • Best Forex Robots
  • Best Forex Signals
  • Best Forex Managed Accounts

Top Trading Markets

We are dedicated to demystify the world of forex trading for you – no matter what level you are on.

Categories
  • Automated Trading
  • Crypto Robot Review
  • Cryptocurrency Trading
  • Day Trading
  • Forex Basics
  • Forex Brokers
  • Forex Education
  • Forex Forecasts
  • Forex Indicators
  • Forex Market Commentary
  • Forex Robots
  • Forex Signals
  • Forex Signals
  • Forex Tools
  • Forex Trading Strategies
  • Forex VPS
  • Fundamental Analysis
  • Managed Accounts
  • Money Management
  • News
  • Review
  • Review Platforms
  • Risk Management
  • Social Trading
  • Technical Analysis
  • Top World Traders
  • Trading Apps
  • Trading Psychology
  • Uncategorized
Tags
Acquisition AI Amazon Apple Artificial Intelligence Bitcoin bond yields CEO China earnings earnings report economy Electric Vehicles Federal Reserve financial performance Financial Results forex ea forex software reviews Growth Guidance Housing Market inflation interest rates Investing investment Investors Market Volatility merger mortgage rates net profit Nvidia Oil prices Q2 Results revenue Revenue Growth Sales sales growth Stock Futures stock market stock performance Stocks strategies technology Tesla Video
  • Terms of Use
  • Privacy Policy
  • Compensation Disclosure
  • Risk Disclosure
  • About Us
  • Contact Us

Copyright © 2023 by ForexEzy.com

No Result
View All Result
  • Top Forex Advisors
    • Best Forex Robots
    • Best Forex Signals
    • Best Managed Accounts
  • Top Forex Brokers
    • Best Forex Brokers
    • US Forex Brokers
    • UK Forex Brokers
    • MT4 Forex Brokers
    • MT5 Forex Brokers
    • Zero Spread Brokers
    • Best PayPal Brokers
    • TradingView Brokers
    • Social Trading Platforms
  • Top Review Platforms
  • Forex Education
    • Getting Started
    • Forex Basics
    • Forex Trading Strategies
    • Money Management
    • Risk Management
    • Technical Analysis
    • Fundamental Analysis
    • Trading Psychology
    • Social Trading
    • Automated Trading
  • Forex Tools
    • Forex Robots
    • Forex Indicators
    • Forex Signals
    • Forex VPS
  • Forex Forecast
  • Crypto
    • Best Crypto Exchanges
    • Best Crypto Bots
    • Crypto Guides & Forecasts

© 2023, Forexezy. {copy} {year}