ForexEzy
No Result
View All Result
  • Home
  • Forex Education
    • Forex Basics
    • Forex Trading Strategies
    • Money Management
    • Risk Management
    • Technical Analysis
    • Fundamental Analysis
    • Trading Psychology
    • Social Trading
    • Automated Trading
  • Forex Tools
    • Forex Robots
    • Forex Indicators
    • Forex Signals
  • Top Forex Brokers
  • Top Forex Robots
  • Commentary
  • Blog
No Result
View All Result
ForexEzy
No Result
View All Result
Home Forex Education Technical Analysis

Stochastics Indicator – (Ranging Indicators / Oscillators)

by Tim Baudin
September 8, 2016
in Technical Analysis
0
Stochastics Indicator – (Ranging Indicators / Oscillators)
0
SHARES
11
VIEWS
Share on FacebookShare on Twitter

Stochastic oscillator is a popular technical indicator that is used in the short term, midterm and long term trading. This indicator was developed by George C. Lane in 1950.

The stochastic indicator is a momentum indicator that actually follows the speed or momentum of price rather than following the price.

This is why this indicator can change before the price and lead the price. This is a leading indicator that has a specific range of 0 to 100. Like many other leading indicators, this indicator also has overbought and oversold levels.

Calculation:

The calculation of stochastic indicator is as follows,

%K = (Current Close – Lowest Low) / (Highest High – Lowest Low) x 100

%D = 3 day SMA of %K

Here,

Lowest Low = lowest low for n number of periods

Highest High = highest high for n number of periods

The default period for this indicator is 14 (n=14). However, traders can change the period according to their own preference.

Interpretation:

The stochastic indicator consists of two different lines, %K and %D. These lines move according to the price change momentum in a range of 0 to 100. This range has given this indicator a leading nature over price. This indicator has overbought and oversold levels.

The overbought level is a psychological resistance level that lies between 80 and 100. The oversold level is a psychological support level that lies between 0 and 20. In a case of many other leading indicators (such as RSI), buy signal generated as indicator moves into or above oversold region. But this indicator generates bullish crossovers in the oversold region that help traders to take early entries.

Traders can take early sell decisions as stochastic indicator generates a bearish crossover in overbought region. A bullish crossover occurs as soon as %K line crosses above %D line. The bearish crossover occurs as %K line crosses below %D line.

Stochastic-Oscillator

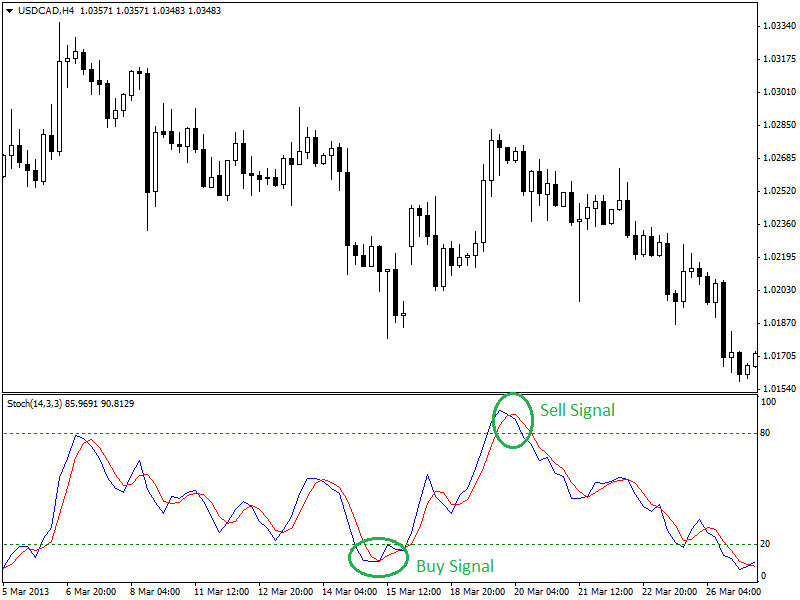
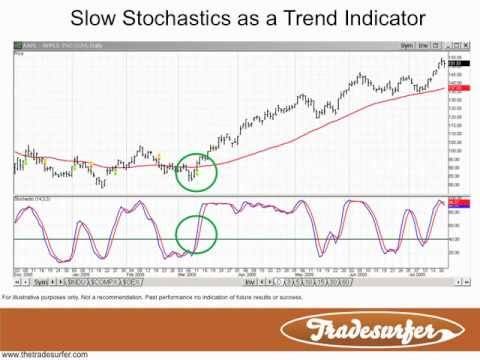
4-hour chart of USD/CAD (given above) is showing buy and sell signals at oversold and overbought levels. Combining with other indicators such as moving averages to understand trends would boost up the performance of trading with this indicator. Traders can also use trend lines for trend following trading approach.

For more confirmed trading signals, traders might use the 50 line or centerline of the stochastic indicator.  Buy signal generates as %K line crosses above 50 line or centerline. Inversely, sell signal generates as %K line crosses below centerline or 50 line.

4-hour-chart-of-AUDUSD1

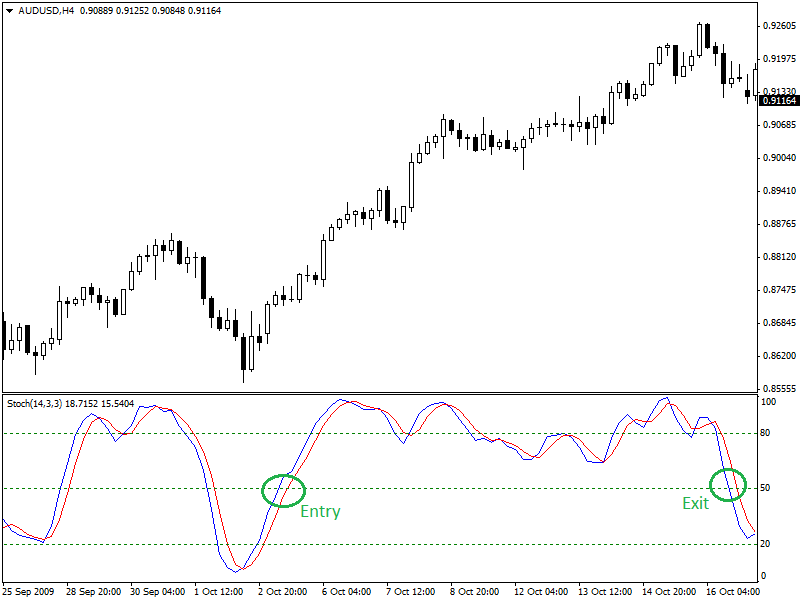
4-hour chart of AUD/USD is showing entry and exit signals for a long position. Entry signal has taken when %K line crosses centerline after crossing 20 line. Exit signal generated as %K line drops below the centerline. This strategy works best while combining with lagging indicators such as MACD, Moving Averages etc.

Summary:

Leading indicators or oscillators should not use individually as most of them can not determine trend direction. Lagging indicators or trend indicators should be used with a stochastic indicator as a combination.

ShareTweet
Previous Post

12 Trading Mantras from Trading Legend Mark Douglas

Next Post

Williams %R Indicator – (Ranging Indicators / Oscillators)

Related Posts

How to Trade Using Horn Bottoms in Bullish Markets

How to Trade Using Horn Bottoms in Bullish Markets

by Chintan Patel
April 16, 2021
0

Introduction Horn bottoms are down-trending spikes on trading charts. The pattern consists of two spikes that are visible on the...

An Introduction To Forex Momentum Indicators

An Introduction To Forex Momentum Indicators

by Tim Baudin
January 19, 2021
0

Overview There is a recurring belief in trading communities that price lies, but momentum doesn’t. The forex market is somewhat...

An Introduction To Forex Indicators

An Introduction To Forex Indicators

by Chintan Patel
January 1, 2021
0

What are the Forex indicators? A vast part of technical analysis is understanding and trading with these tools. Although they...

Using Trendlines and Saucer Formations in Trading

Using Trendlines and Saucer Formations in Trading

by Tim Baudin
December 21, 2020
0

Trendlines are those lines that you can recognize easily. A trader draws trendlines on charts in order to connect a...

RSI - Top 3 Real Charts You've Missed

RSI – Top 3 Real Charts You’ve Missed

by Tim Baudin
December 17, 2020
0

Overview Are you still doubting the power of the RSI? This article will cover three recent forex trading opportunities mostly...

Load More

Best Forex EA

  • ROFX 9/10
  • Forex Fury 8/10
  • FXgoodway 7.5/10
  • Z Trader FX EA 7/10
  • Forex Incontrol Reborn 6.5/10

Popular News

  • The Best RSI and CCI Combination Trading Strategy for Optimum Returns

    The Best RSI and CCI Combination Trading Strategy for Optimum Returns

    2 shares
    Share 2 Tweet 0
  • Rofx Review – High Profitability and Stable Performance Analysis

    29 shares
    Share 29 Tweet 0
  • The Best Forex Scalping Strategy – Using 3 Popular Technical Indicators

    0 shares
    Share 0 Tweet 0
  • The Best MT4 Indicators & Expert Advisors For Forex Trading

    2 shares
    Share 2 Tweet 0
  • How to check if the indicator is repainting?

    2 shares
    Share 2 Tweet 0

Trading

Footer

We are dedicated to demystify the world of forex trading for you – no matter what level you are on.

Categories
  • Automated Trading
  • Day Trading
  • Forex Basics
  • Forex Brokers
  • Forex Education
  • Forex Forecasts
  • Forex Indicators
  • Forex Market Commentary
  • Forex Robots
  • Forex Signals
  • Forex Tools
  • Forex Trading Strategies
  • Fundamental Analysis
  • Money Management
  • News
  • Risk Management
  • Social Trading
  • Technical Analysis
  • Top World Traders
  • Trading Psychology
  • Uncategorized
Tags
arbitrage atr bollinger bands cci chart patterns classics copy trading courses day trading forex brokers forex charts forex ea forex education forex forecasting Forex Indicators forex software reviews grid trading hedging ichimoku macd market cycles news trading oscillators price action trading rsi social trading strategies tips & tricks trading bots trading platforms trend trading Video
  • Terms of Use
  • Privacy Policy
  • Compensation Disclosure
  • Risk Disclosure
  • About Us
  • Contact Us

Copyright © 2021 by ForexEzy.com

No Result
View All Result
  • Home
  • Forex Education
    • Forex Basics
    • Forex Trading Strategies
    • Money Management
    • Risk Management
    • Technical Analysis
    • Fundamental Analysis
    • Trading Psychology
    • Social Trading
    • Automated Trading
  • Forex Tools
    • Forex Robots
    • Forex Indicators
    • Forex Signals
  • Top Forex Brokers
  • Top Forex Robots
  • Commentary
  • Blog

© 2021, Forexezy.