ForexEzy
No Result
View All Result
  • Top Forex Advisors
    • Best Forex Robots
    • Best Forex Signals
    • Best Managed Accounts
  • Top Forex Brokers
    • Best Forex Brokers
    • US Forex Brokers
    • UK Forex Brokers
    • MT4 Forex Brokers
    • MT5 Forex Brokers
    • Zero Spread Brokers
    • Best PayPal Brokers
    • TradingView Brokers
    • Social Trading Platforms
  • Top Review Platforms
  • Forex Education
    • Getting Started
    • Forex Basics
    • Forex Trading Strategies
    • Money Management
    • Risk Management
    • Technical Analysis
    • Fundamental Analysis
    • Trading Psychology
    • Social Trading
    • Automated Trading
  • Forex Tools
    • Forex Robots
    • Forex Indicators
    • Forex Signals
    • Forex VPS
  • Forex Forecast
  • Crypto
    • Best Crypto Exchanges
    • Best Crypto Bots
    • Crypto Guides & Forecasts
No Result
View All Result
ForexEzy
No Result
View All Result
The World’s Leading Social Trading Platform
Try now
Home Forex Education Technical Analysis

Williams %R Indicator – (Ranging Indicators / Oscillators)

by Tim Baudin
September 8, 2016
in Technical Analysis
0
0
SHARES
11
VIEWS
Share on FacebookShare on Twitter

Williams % R is a leading indicator described in 1973 by Larry Williams. It is an effective and a famous technical indicator. This indicator is used mostly in case of short term trading methods.

Like many other leading indicators, this indicator has overbought and oversold levels.

Calculation:

This indicator has a simple calculation. Here it is,

%R = (Highest High – Close) / (Highest High – Lowest Low) x (-100)

Here,

Lowest Low = Lowest Low for the specific look back period

Highest High = Highest High for the specific look back period

The default look back period of %R indicator is 14. However, traders can change this parameter if they want.

Interpretation:

Like many other leading indicators, Williams % R has a range and overbought-oversold levels. The range of this indicator is 0 to -100 which means the value of this indicator always lies in this range. -80 to -100 level is considered as oversold and 0 to -20 level is considered as overbought level.

The oversold region is a psychological support level and the overbought region is a psychological resistance level.

The basic method to use this indicator is to buy at oversold region and sell at the overbought region. But this technique carries many false signals. Thus, most of the traders use the centerline crossover of this indicator. -50 line is the centerline of % R indicator.

A buy signal generated as % R moves upward from the oversold region and crosses above the centerline.

Inversely, a sell signal generated as % R moves downward from an overbought region and crosses below the centerline.

Williams-Percent-R

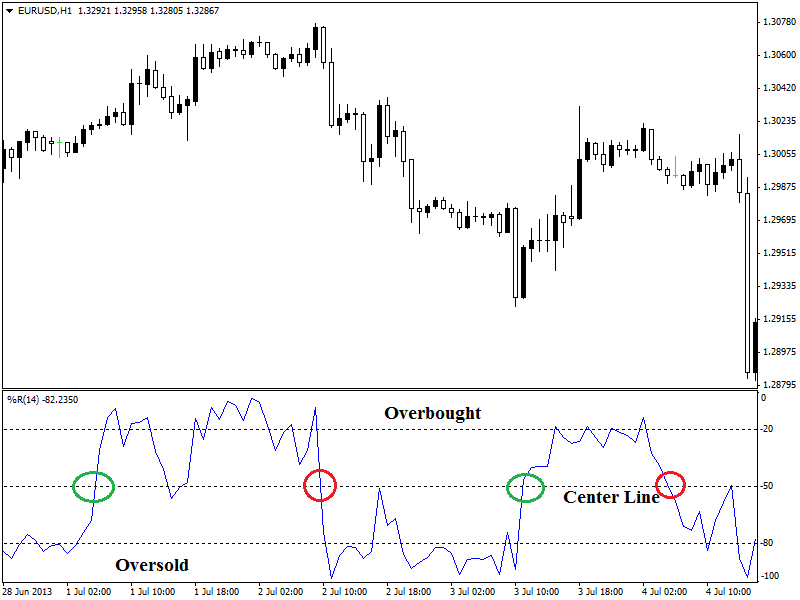
1 Hour EUR/USD chart (given above), is showing overbought, oversold and centerline of % R indicator. The Green colored circle is showing buy signals and red colored circles are showing sell signals.

Another method to use this indicator trading is to buy at overbought and sell at oversold. There are many traders who like the crowd and jump into it to make money from the crowd. When a pair is overbought, it means that there is a strong buying pressure.

This buying pressure does not fade out immediately and most of the times provide an opportunity to make a profit. Traders often take a long position as soon as % R becomes overbought and take a short position as % R becomes oversold.

1-hour-chart-of-EURUSD

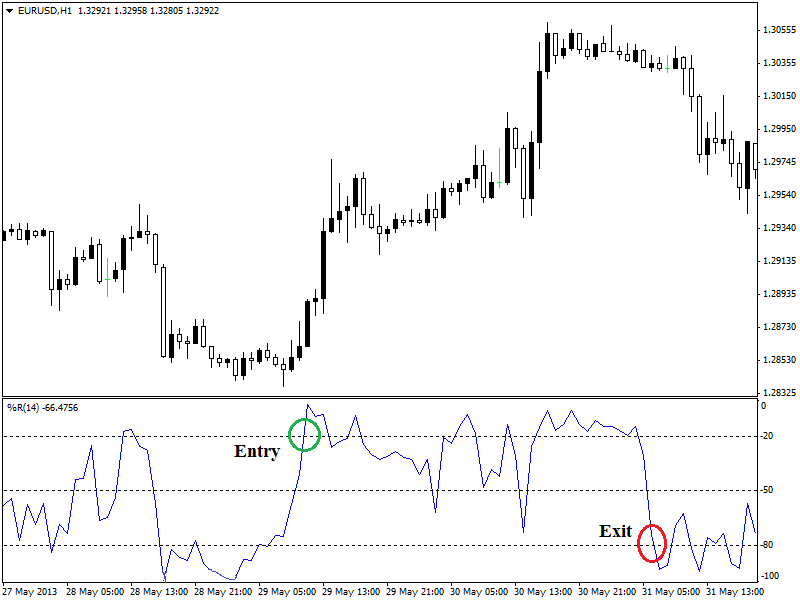
1-hour chart of EUR/USD (given above) showing entry and exit signal for a long position. Entry signal has taken as soon as % R moves above -20 which is overbought region. Exit signal has taken as % R moves below -80 line which is oversold region.

1-hour-EURUSD-chart

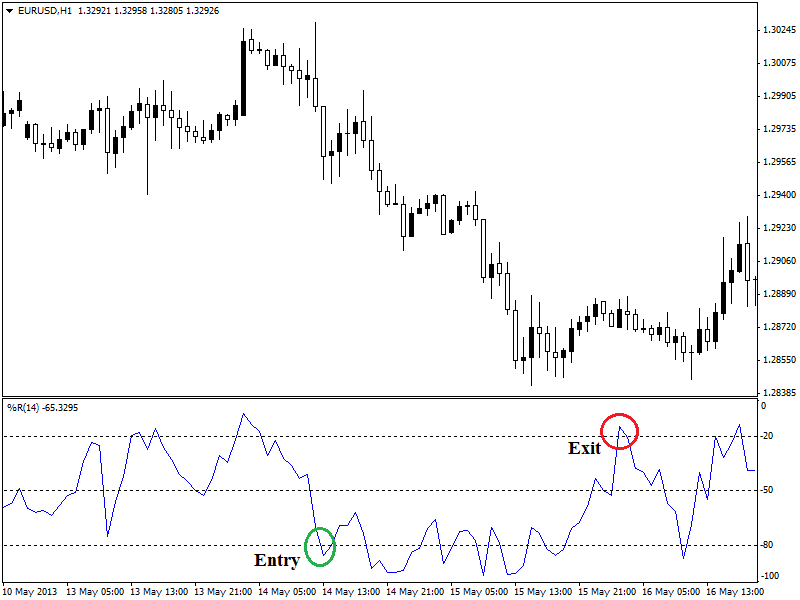
1-hour EUR/USD chart (given above) is showing entry and exit signals for a short position. Entry signal has occurred as % R moved below -80 which is oversold region. Exit signal generated as % R moves above -80 line which is considered as an overbought region.

Summary:

Williams % R indicator is a leading indicator applicable for the short term trading approach. This indicator is useful for the price change momentum. This indicator can not identify the long-term trend, thus, other trend indicators should be used in a combination.

The Best Forex Robots Report Is Already Here!
best forex robots
Check out 30+ best expert advisors with daily updated live results and statistics
Click Here
The Best Forex Robots Report Is Already Here!
best forex robots
Check out 30+ best expert advisors with daily updated live results and statistics
Click Here
ShareTweet
Previous Post

Stochastics Indicator – (Ranging Indicators / Oscillators)

Next Post

Commodity Channel Index (CCI) – A Popular Oscillator

Related Posts

Trading With Balance of Power Indicator

Trading With Balance of Power Indicator

by Adam Stanley
December 9, 2021
0

The Balance of Power (BOP) indicator is an analysis tool created by Igor Livshin in August 2001. It tracks the...

What Are Pennant Chart Patterns in Forex: Step by Step Guide

What Are Pennant Chart Patterns in Forex: Step by Step Guide

by Chintan Patel
November 15, 2021
0

Continuation patterns in the forex market are a common occurrence whenever there is a large movement in one direction followed...

How To Trade Ascending Scallops in Forex

How To Trade Ascending Scallops in Forex

by Adam Stanley
November 10, 2021
0

Price in the Forex market does not always move in one direction. After a significant move in one direction, up...

Inverted Scallops in Forex Chart Patterns: Step by Step Guide

Inverted Scallops in Forex Chart Patterns: Step by Step Guide

by Adam Stanley
November 9, 2021
0

Whenever prices move up significantly in the forex market, exhaustion often kicks in. In most cases, the fatigue is usually...

Elder’s Method in Forex Trading

Elder’s Method in Forex Trading

by Tim Baudin
November 3, 2021
0

There are several strategies that traders and analysts have developed over the years, all in a bid to milk the...

Load More

Best Forex Automated Systems

  • TechBerry 9/10
  • Happy Galaxy 8.5/10
  • Forex Cyborg 8.5/10
  • Forex Fury 8/10
  • FXgoodway 7.5/10
  • Best Forex Brokers
  • Best Forex Robots
  • Best Forex Signals
  • Best Forex Managed Accounts

Top Trading Markets

We are dedicated to demystify the world of forex trading for you – no matter what level you are on.

Categories
  • Automated Trading
  • Crypto Robot Review
  • Cryptocurrency Trading
  • Day Trading
  • Forex Basics
  • Forex Brokers
  • Forex Education
  • Forex Forecasts
  • Forex Indicators
  • Forex Market Commentary
  • Forex Robots
  • Forex Signals
  • Forex Signals
  • Forex Tools
  • Forex Trading Strategies
  • Forex VPS
  • Fundamental Analysis
  • Managed Accounts
  • Money Management
  • News
  • Review
  • Review Platforms
  • Risk Management
  • Social Trading
  • Technical Analysis
  • Top World Traders
  • Trading Apps
  • Trading Psychology
  • Uncategorized
Tags
Acquisition AI Amazon Apple Artificial Intelligence Bitcoin bond yields CEO China earnings earnings report economy Electric Vehicles Federal Reserve financial performance Financial Results forex ea forex software reviews Growth Guidance Housing Market inflation interest rates Investing investment Investors Market Volatility merger mortgage rates net profit Nvidia Oil prices Q2 Results revenue Revenue Growth Sales sales growth Stock Futures stock market stock performance Stocks strategies technology Tesla Video
  • Terms of Use
  • Privacy Policy
  • Compensation Disclosure
  • Risk Disclosure
  • About Us
  • Contact Us

Copyright © 2023 by ForexEzy.com

No Result
View All Result
  • Top Forex Advisors
    • Best Forex Robots
    • Best Forex Signals
    • Best Managed Accounts
  • Top Forex Brokers
    • Best Forex Brokers
    • US Forex Brokers
    • UK Forex Brokers
    • MT4 Forex Brokers
    • MT5 Forex Brokers
    • Zero Spread Brokers
    • Best PayPal Brokers
    • TradingView Brokers
    • Social Trading Platforms
  • Top Review Platforms
  • Forex Education
    • Getting Started
    • Forex Basics
    • Forex Trading Strategies
    • Money Management
    • Risk Management
    • Technical Analysis
    • Fundamental Analysis
    • Trading Psychology
    • Social Trading
    • Automated Trading
  • Forex Tools
    • Forex Robots
    • Forex Indicators
    • Forex Signals
    • Forex VPS
  • Forex Forecast
  • Crypto
    • Best Crypto Exchanges
    • Best Crypto Bots
    • Crypto Guides & Forecasts

© 2023, Forexezy. {copy} {year}