ForexEzy
No Result
View All Result
  • Top Forex Advisors
    • Best Forex Robots
    • Best Forex Signals
    • Best Managed Accounts
  • Top Forex Brokers
    • Best Forex Brokers
    • US Forex Brokers
    • UK Forex Brokers
    • MT4 Forex Brokers
    • MT5 Forex Brokers
    • Zero Spread Brokers
    • Best PayPal Brokers
    • TradingView Brokers
    • Social Trading Platforms
  • Top Review Platforms
  • Forex Education
    • Getting Started
    • Forex Basics
    • Forex Trading Strategies
    • Money Management
    • Risk Management
    • Technical Analysis
    • Fundamental Analysis
    • Trading Psychology
    • Social Trading
    • Automated Trading
  • Forex Tools
    • Forex Robots
    • Forex Indicators
    • Forex Signals
    • Forex VPS
  • Forex Forecast
  • Crypto
    • Best Crypto Exchanges
    • Best Crypto Bots
    • Crypto Guides & Forecasts
No Result
View All Result
ForexEzy
No Result
View All Result
The World’s Leading Social Trading Platform
Try now
Home Forex Education Technical Analysis

Inverted Scallops in Forex Chart Patterns: Step by Step Guide

by Adam Stanley
November 9, 2021
in Technical Analysis
0
Inverted Scallops in Forex Chart Patterns: Step by Step Guide
0
SHARES
11
VIEWS
Share on FacebookShare on Twitter

Whenever prices move up significantly in the forex market, exhaustion often kicks in. In most cases, the fatigue is usually a result of people exiting positions to lock in profits. The aftermath is usually consolidation, with prices moving slower and in tight ranges. One of the patterns that often come about during such periods of consolidation is the Inverted scallop.

The Best Forex Robots Report Is Already Here!
best forex robots
Check out 30+ best expert advisors with daily updated live results and statistics
Click Here

What is an Inverted scallop?

Traders can see the chart pattern that comes into play during bullish rallies. It can also occur at the start of an uptrend and during breakouts. It appears as an inverted J whereby prices move up significantly only to reach a peak and start correcting lower, resulting in a rounded top.

Instead of a steep pullback, the price often forms lower lows that result in a rounded top. The rounded top, when combined with the previous steep uptick, confirms the inverted scallop pattern. Given the underlying uptrend, the expectation is usually high that the price will correct after the small pullback and move higher in continuation of the underlying uptrend.

Formation

The chart below shows the formation of an inverted scallop. In the first part, the price is seen moving up steadily as bulls were in control.

Chart showing  inverted Scallop outline

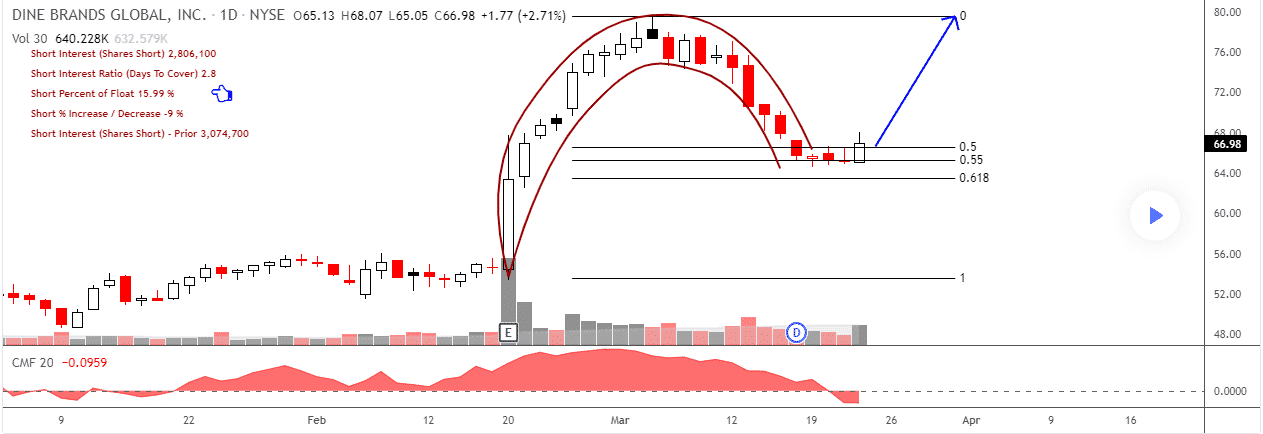
However, exhaustion started to kick in as soon as the Dine Brands Global share price reached near the $80 mark. The result was price edging lower as some people took profits. The correction to the 0.5% mark affirmed the formation of an inverted J. Price holding, and correcting up from the 50% correction only affirms the Inverted scallop pattern.

Guidelines to identifying inverted scallop

  • The market should be in an uptrend.
  • After the price has moved up significantly, a rounded top should appear; not v-shaped.
  • The correction resulting in the rounded top should not be more than 50% of the uptrend.
  • Price should bounce back and power through the previous top on the rounded top.

How to trade?

While looking to profit from the inverted scallop outline, it is important to wait and see if the pullback will hold and that price will not edge lower. The correction from the top should not be more than 50% for the pattern to hold. A correction of more than 50% will essentially mean the underlying trend is not an inverted J.

Chart showing inverted scallop conformation

Once the pullback holds and does not correct more than 50%, one can look to open long positions as it indicates bulls are in control and likely to steer prices higher once the consolidation phase comes to an end.

The inverted scallop outline is confirmed by a bounce back to the previous high. A rally followed by a close above the previous high affirms the strength of the upward momentum, paving the way to open a long position.

In most cases, one can open a long position once the inverted J outline appears and prices fail to edge lower. Once a bullish candlestick emerges at the new support or the end of the rounded top, one can enter a buy order.

However, one can wait for further confirmation, which would come in the form of price bouncing off the support and powering back to the previous top. Once it breaks out of the previous top on strength, one can trigger a position to try and profit on further upside action.

The best play on risk-reward is to wait for the price to close above the previous top after the confirmation of the inverted scallop to trade. The bounce back, in this case, affirms the underlying uptrend signaling the consolidation wave is over and that the market is about to move up and register new highs.

Stop loss and take profit

The stop-loss order can be placed a few pips below the level at which a buy position is triggered. For instance, it can be placed 10 to 20 pips below the confirmation level if a buy position is opened after the price has broken out of the previous high.

Similarly, if the long position was triggered near the end of the rounded top, one can place the stop-loss order a few pips below close to where the previous move up started.

On the other hand, the take profit level can be measured as the height of the J pattern, in this case, measuring where the j pattern started to where the rounded top started to appear. The height can then be extrapolated from where a long position is triggered to ascertain the place to exit a trade and lock in profits.

Swing traders are known to open long positions at the end of the scallop and exit the market as soon as the price corrects back to the highest level of the pattern. However, if the underlying volume and momentum is high, one can let the profits run on price breaking out of the previous high and registering a new top.

What to remember

The Inverted scallop pattern occurs in markets that are trending up and appear as an inverted J. The correction that follows after a new high is registered should not be more than 50% of the underlying trend for the pattern to hold. A correction of less than 50% ensures the rounded top holds perfectly to justify the inverted J outline.

Long positions can be opened depending on how confident one is about the strength of the upward momentum. For instance, it can be opened at the end of the scallop, paving the way to open a trade early into the start of a new leg high.

Additionally, one can wait for confirmation that the consolidation phase is over and that the upward momentum is strong enough to trigger a much stronger breakout. In this case, one can open a buy position as soon as the price bounces off the scallop level and powers through the previous high to register a new top.

The Best Forex Robots Report Is Already Here!
best forex robots
Check out 30+ best expert advisors with daily updated live results and statistics
Click Here
ShareTweet
Previous Post

FxPro Review

Next Post

Advanced Hedge Review

Related Posts

Trading With Balance of Power Indicator

Trading With Balance of Power Indicator

by Adam Stanley
December 9, 2021
0

The Balance of Power (BOP) indicator is an analysis tool created by Igor Livshin in August 2001. It tracks the...

What Are Pennant Chart Patterns in Forex: Step by Step Guide

What Are Pennant Chart Patterns in Forex: Step by Step Guide

by Chintan Patel
November 15, 2021
0

Continuation patterns in the forex market are a common occurrence whenever there is a large movement in one direction followed...

How To Trade Ascending Scallops in Forex

How To Trade Ascending Scallops in Forex

by Adam Stanley
November 10, 2021
0

Price in the Forex market does not always move in one direction. After a significant move in one direction, up...

Elder’s Method in Forex Trading

Elder’s Method in Forex Trading

by Tim Baudin
November 3, 2021
0

There are several strategies that traders and analysts have developed over the years, all in a bid to milk the...

Trading With Spinning Tops and Doji Candlestick Pattern

Trading With Spinning Tops and Doji Candlestick Pattern

by Tim Baudin
October 29, 2021
0

Japanese candlestick formations go hand-in-hand with various concepts related to chart analysis. Candlestick charts are popular among most of the...

Load More

Leave a Reply Cancel reply

Your email address will not be published. Required fields are marked *

Best Forex Automated Systems

  • TechBerry 9/10
  • Happy Galaxy 8.5/10
  • Forex Cyborg 8.5/10
  • Forex Fury 8/10
  • FXgoodway 7.5/10
  • Best Forex Brokers
  • Best Forex Robots
  • Best Forex Signals
  • Best Forex Managed Accounts

Top Trading Markets

We are dedicated to demystify the world of forex trading for you – no matter what level you are on.

Categories
  • Automated Trading
  • Crypto Robot Review
  • Cryptocurrency Trading
  • Day Trading
  • Forex Basics
  • Forex Brokers
  • Forex Education
  • Forex Forecasts
  • Forex Indicators
  • Forex Market Commentary
  • Forex Robots
  • Forex Signals
  • Forex Signals
  • Forex Tools
  • Forex Trading Strategies
  • Forex VPS
  • Fundamental Analysis
  • Managed Accounts
  • Money Management
  • News
  • Review
  • Review Platforms
  • Risk Management
  • Social Trading
  • Technical Analysis
  • Top World Traders
  • Trading Apps
  • Trading Psychology
  • Uncategorized
Tags
Acquisition AI Amazon Apple Artificial Intelligence Bitcoin bond yields CEO China earnings earnings report economy Electric Vehicles Federal Reserve financial performance Financial Results forex ea forex software reviews Growth Guidance Housing Market inflation interest rates Investing investment Investors Market Volatility merger mortgage rates net profit Nvidia Oil prices Q2 Results revenue Revenue Growth Sales sales growth Stock Futures stock market stock performance Stocks strategies technology Tesla Video
  • Terms of Use
  • Privacy Policy
  • Compensation Disclosure
  • Risk Disclosure
  • About Us
  • Contact Us

Copyright © 2023 by ForexEzy.com

No Result
View All Result
  • Top Forex Advisors
    • Best Forex Robots
    • Best Forex Signals
    • Best Managed Accounts
  • Top Forex Brokers
    • Best Forex Brokers
    • US Forex Brokers
    • UK Forex Brokers
    • MT4 Forex Brokers
    • MT5 Forex Brokers
    • Zero Spread Brokers
    • Best PayPal Brokers
    • TradingView Brokers
    • Social Trading Platforms
  • Top Review Platforms
  • Forex Education
    • Getting Started
    • Forex Basics
    • Forex Trading Strategies
    • Money Management
    • Risk Management
    • Technical Analysis
    • Fundamental Analysis
    • Trading Psychology
    • Social Trading
    • Automated Trading
  • Forex Tools
    • Forex Robots
    • Forex Indicators
    • Forex Signals
    • Forex VPS
  • Forex Forecast
  • Crypto
    • Best Crypto Exchanges
    • Best Crypto Bots
    • Crypto Guides & Forecasts

© 2023, Forexezy. {copy} {year}