ForexEzy
No Result
View All Result
  • Top Forex Advisors
    • Best Forex Robots
    • Best Forex Signals
    • Best Managed Accounts
  • Top Forex Brokers
    • Best Forex Brokers
    • US Forex Brokers
    • UK Forex Brokers
    • MT4 Forex Brokers
    • MT5 Forex Brokers
    • Zero Spread Brokers
    • Best PayPal Brokers
    • TradingView Brokers
    • Social Trading Platforms
  • Top Review Platforms
  • Forex Education
    • Getting Started
    • Forex Basics
    • Forex Trading Strategies
    • Money Management
    • Risk Management
    • Technical Analysis
    • Fundamental Analysis
    • Trading Psychology
    • Social Trading
    • Automated Trading
  • Forex Tools
    • Forex Robots
    • Forex Indicators
    • Forex Signals
    • Forex VPS
  • Forex Forecast
  • Crypto
    • Best Crypto Exchanges
    • Best Crypto Bots
    • Crypto Guides & Forecasts
No Result
View All Result
ForexEzy
No Result
View All Result
The World’s Leading Social Trading Platform
Try now
Home Forex Education Technical Analysis

What Are Pennant Chart Patterns in Forex: Step by Step Guide

by Chintan Patel
November 15, 2021
in Technical Analysis
0
What Are Pennant Chart Patterns in Forex: Step by Step Guide
0
SHARES
11
VIEWS
Share on FacebookShare on Twitter

Continuation patterns in the forex market are a common occurrence whenever there is a large movement in one direction followed by a period of consolidation. The consolidation phase is usually a period of exhaustion whereby price oscillates up and down within a tight range, often followed by a strong breakout. A pennant is one such pattern that comes about after a strong movement in one direction.

The Best Forex Robots Report Is Already Here!
best forex robots
Check out 30+ best expert advisors with daily updated live results and statistics
Click Here

Understanding pennant

A pennant’s structure is similar to a flag in that there is usually a phase of a strong price movement either up or down, resulting in what looks like a flagpole. At the peak or trough of the pole, a pennant occurs whereby the price oscillates in what looks like a small triangle before a breakout occurs.

Image introducing pennant patterns

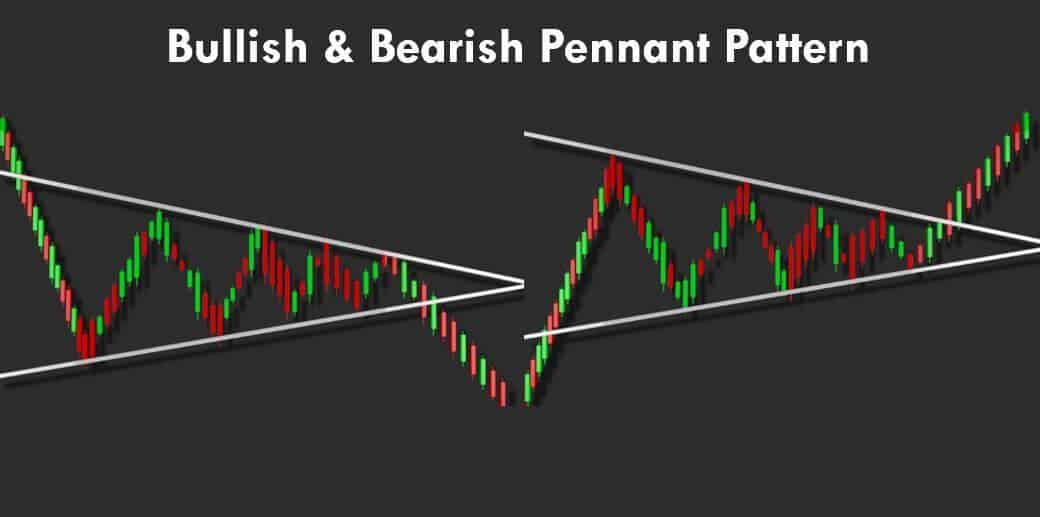
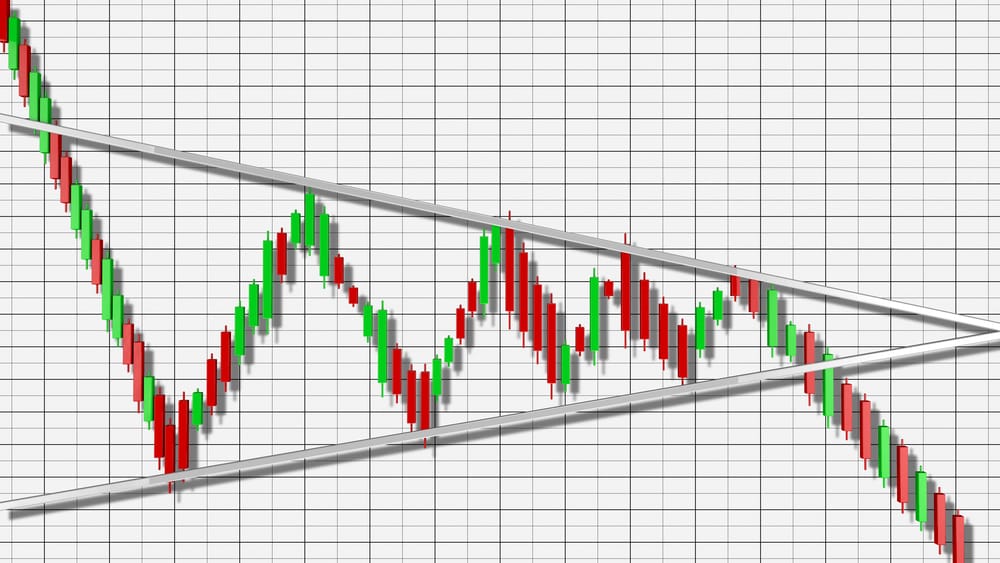
The pennant that forms after the price has moved strongly and comes in the form of converging trendlines. In this case, price oscillates within the tight converging trend lines before breaking out. The breakout, in most cases, is usually in the direction of the underlying trend.

Bullish pennants

The trick to identifying these patterns starts with ascertaining the underlying long-term trend and ensuring it is bullish. The uptrend should come with a series of higher highs and higher lows, affirming that buyers are in control.

If the upward momentum is strong enough, whenever a pullback comes into play, the bulls will be able to defend any pullback that threatens to take the price lower. In this case, the pullback from the flagpole should not be more than 50% of the trend move. A more than 50% pullback affirms waning upward momentum, signaling that price is likely to edge lower and that the pattern would be more of a triangle than a pennant.

The shorter the correction from the flagpole, less than 38%, the stronger the uptrend and the likelihood of price edging higher once the consolidation phase is over.

image showing bullish pennant formation.

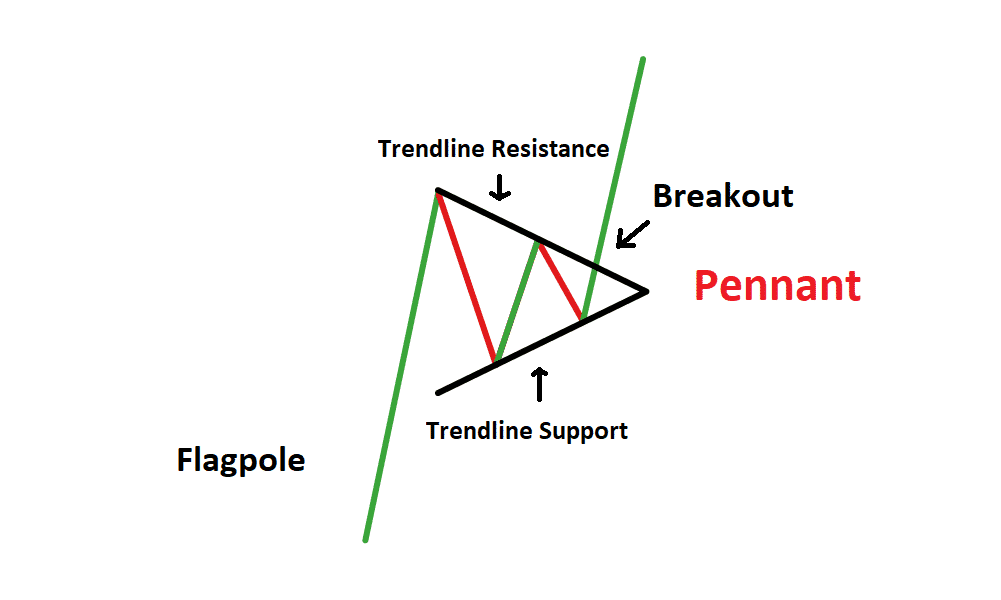
In the bullish pennant outline above, the price moved up, after which exhaustion kicked in, resulting in it pulling back. The pullback results in price oscillating in fine margins forming a higher low and lower high. However, after some time, the price broke out to the upside in the direction of the underlying uptrend.

Bearish pennant

In the case of a bearish pennant setup, the underlying trend that forms the flagpole should be bearish. The downtrend should be categorized by a series of lower lows and lower highs. Once the consolidation comes resulting in a pennant, one should look to enter a short position once it breaks out of the lower trend line support line.

image showing bearish pennant formation

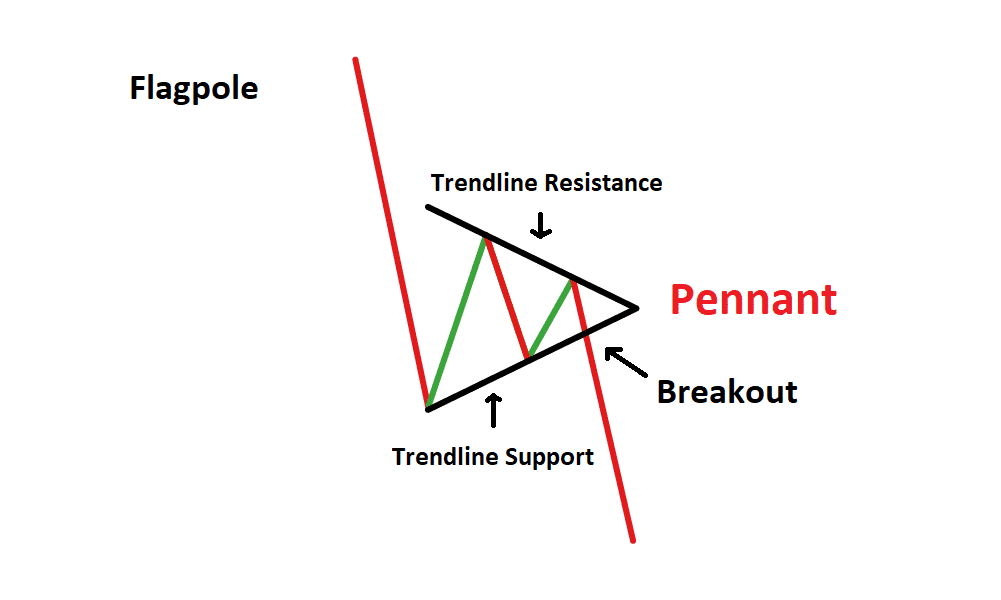
In the bearish pennant setup, the price was moving lower, after which it pulled back. The initial pullback experienced some strong resistance resulting in price tanking forming a lower high. As price oscillated within the converging trendlines, it finally broke out and continued to move lower in continuation of the underlying downtrend.

The shorter the pullback from the flagpole, the stronger the downtrend. In this case, if the price was to pull back by less than 38% of the trend move, the higher the likelihood of a strong movement to the downside once a breakout occurs from the pennant outline.

How to trade pennants

While trading pennants, it is important to pay attention to the underlying trend. For instance, if the underlying trend is bullish, one should look for buy positions as soon as the price enters the consolidation phase in the form of a pennant. Similarly, one should look to enter short positions if the underlying trend preceding a pennant is bearish.

image showing bullish pennant breakout

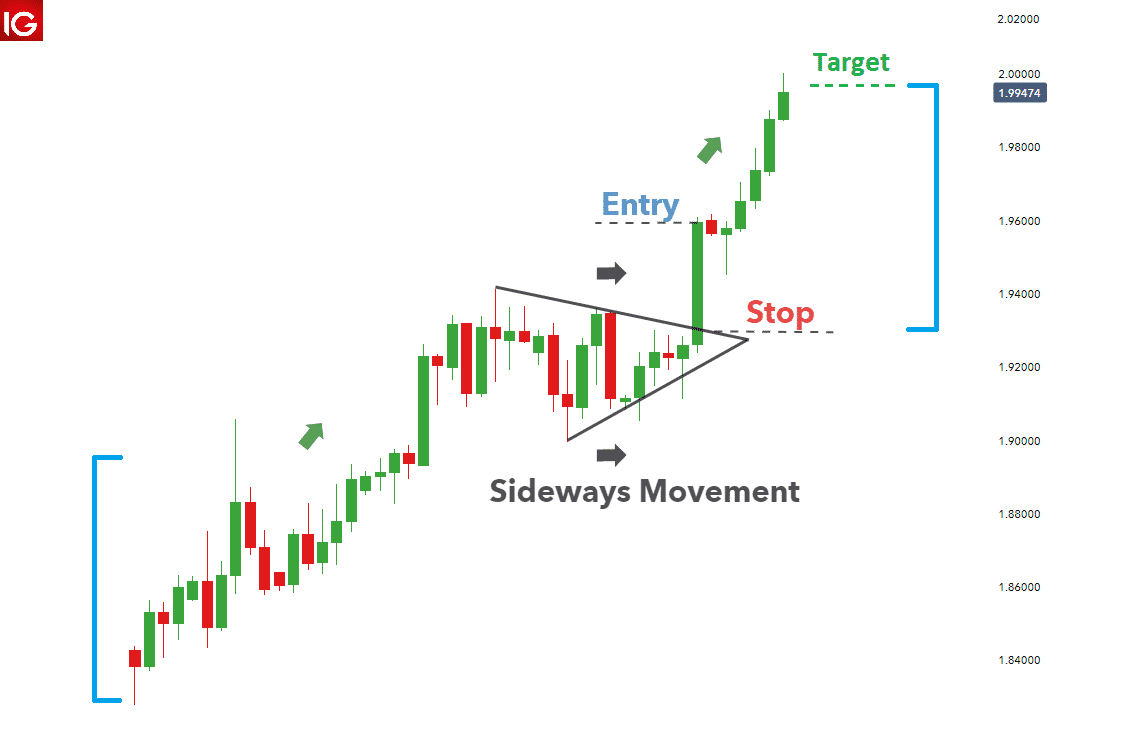
In the chart above, the price is trending up before a sideways movement comes into play in the form of a pennant. In this case, emphasis is placed on entering long positions on price breaking to the upwards.

The long position should only be opened once the candlestick out of the pennant formation signals bulls are in control, as is the case in the chart above. Once the bullish candlestick closes outside the pennant, one can trigger a long position to profit as price trends up in the continuation of the underlying bullish momentum.

A stop loss to mitigate against losses once the buy position is triggered can be placed a few pips above the descending trend line of the pennant. In addition, a more conservative stop loss can be placed a few pips below the pennant as a way of offering a level of protection and giving the market time to play out to the upside.

The profit target can be established by applying the initial height of the flagpole to the entry point of the long position. In most cases, it is expected that the price will move the same height as the flagpole once it breaks out of the pennant.

Pennants vs. triangles

While pennants resemble a triangle pattern, they also differ a great deal. For starters, a pattern is considered a pennant only if a strong up or down movement precedes it, forming a flagpole. The lack of a flagpole justifies the formation of a triangle pattern.

Image showing triangle vs. pennant patterns

In addition, a pattern qualifies to be a pennant only if the retracement from the underlying trend is less than 38%. The correction that proceeds the consolidation in a tight range should be much smaller. A deep correction of more than 38% would often signal the formation of a triangular pattern.

In most cases, a pennant is usually a short-term pattern that can last a few days to weeks. In contrast, a triangle is a much longer-term pattern than can last months.

Bottom line

Pennant is a common chart pattern that comes about after a strong movement in price, either up or down. The strong move is usually followed by a consolidation where the price oscillates in a tight trading range.

During the initial phase of the pattern, price should move with strong volume resulting in the formation of a flagpole-like structure as price makes higher highs or lower lows. Once the pennant forms, it is expected that the breakout that comes about should be in the direction of the underlying trend.

The Best Forex Robots Report Is Already Here!
best forex robots
Check out 30+ best expert advisors with daily updated live results and statistics
Click Here
ShareTweet
Previous Post

AvaTrade Review

Next Post

EA Black Dragon Review

Related Posts

Trading With Balance of Power Indicator

Trading With Balance of Power Indicator

by Adam Stanley
December 9, 2021
0

The Balance of Power (BOP) indicator is an analysis tool created by Igor Livshin in August 2001. It tracks the...

How To Trade Ascending Scallops in Forex

How To Trade Ascending Scallops in Forex

by Adam Stanley
November 10, 2021
0

Price in the Forex market does not always move in one direction. After a significant move in one direction, up...

Inverted Scallops in Forex Chart Patterns: Step by Step Guide

Inverted Scallops in Forex Chart Patterns: Step by Step Guide

by Adam Stanley
November 9, 2021
0

Whenever prices move up significantly in the forex market, exhaustion often kicks in. In most cases, the fatigue is usually...

Elder’s Method in Forex Trading

Elder’s Method in Forex Trading

by Tim Baudin
November 3, 2021
0

There are several strategies that traders and analysts have developed over the years, all in a bid to milk the...

Trading With Spinning Tops and Doji Candlestick Pattern

Trading With Spinning Tops and Doji Candlestick Pattern

by Tim Baudin
October 29, 2021
0

Japanese candlestick formations go hand-in-hand with various concepts related to chart analysis. Candlestick charts are popular among most of the...

Load More

Leave a Reply Cancel reply

Your email address will not be published. Required fields are marked *

Best Forex Automated Systems

  • TechBerry 9/10
  • Happy Galaxy 8.5/10
  • Forex Cyborg 8.5/10
  • Forex Fury 8/10
  • FXgoodway 7.5/10
  • Best Forex Brokers
  • Best Forex Robots
  • Best Forex Signals
  • Best Forex Managed Accounts

Top Trading Markets

We are dedicated to demystify the world of forex trading for you – no matter what level you are on.

Categories
  • Automated Trading
  • Crypto Robot Review
  • Cryptocurrency Trading
  • Day Trading
  • Forex Basics
  • Forex Brokers
  • Forex Education
  • Forex Forecasts
  • Forex Indicators
  • Forex Market Commentary
  • Forex Robots
  • Forex Signals
  • Forex Signals
  • Forex Tools
  • Forex Trading Strategies
  • Forex VPS
  • Fundamental Analysis
  • Managed Accounts
  • Money Management
  • News
  • Review
  • Review Platforms
  • Risk Management
  • Social Trading
  • Technical Analysis
  • Top World Traders
  • Trading Apps
  • Trading Psychology
  • Uncategorized
Tags
Acquisition AI Amazon Apple Artificial Intelligence Bitcoin bond yields CEO China earnings earnings report economy Electric Vehicles Federal Reserve financial performance Financial Results forex ea forex software reviews Growth Guidance Housing Market inflation interest rates Investing investment Investors Market Volatility merger mortgage rates net profit Nvidia Oil prices Q2 Results revenue Revenue Growth Sales sales growth Stock Futures stock market stock performance Stocks strategies technology Tesla Video
  • Terms of Use
  • Privacy Policy
  • Compensation Disclosure
  • Risk Disclosure
  • About Us
  • Contact Us

Copyright © 2023 by ForexEzy.com

No Result
View All Result
  • Top Forex Advisors
    • Best Forex Robots
    • Best Forex Signals
    • Best Managed Accounts
  • Top Forex Brokers
    • Best Forex Brokers
    • US Forex Brokers
    • UK Forex Brokers
    • MT4 Forex Brokers
    • MT5 Forex Brokers
    • Zero Spread Brokers
    • Best PayPal Brokers
    • TradingView Brokers
    • Social Trading Platforms
  • Top Review Platforms
  • Forex Education
    • Getting Started
    • Forex Basics
    • Forex Trading Strategies
    • Money Management
    • Risk Management
    • Technical Analysis
    • Fundamental Analysis
    • Trading Psychology
    • Social Trading
    • Automated Trading
  • Forex Tools
    • Forex Robots
    • Forex Indicators
    • Forex Signals
    • Forex VPS
  • Forex Forecast
  • Crypto
    • Best Crypto Exchanges
    • Best Crypto Bots
    • Crypto Guides & Forecasts

© 2023, Forexezy. {copy} {year}