ForexEzy
No Result
View All Result
  • Top Forex Advisors
    • Best Forex Robots
    • Best Forex Signals
    • Best Managed Accounts
  • Top Forex Brokers
    • Best Forex Brokers
    • US Forex Brokers
    • UK Forex Brokers
    • MT4 Forex Brokers
    • MT5 Forex Brokers
    • Zero Spread Brokers
    • Best PayPal Brokers
    • TradingView Brokers
    • Social Trading Platforms
  • Getting Started
  • Forex Education
    • Forex Basics
    • Forex Trading Strategies
    • Money Management
    • Risk Management
    • Technical Analysis
    • Fundamental Analysis
    • Trading Psychology
    • Social Trading
    • Automated Trading
  • Forex Tools
    • Forex Robots
    • Forex Indicators
    • Forex Signals
    • Forex VPS
  • Forex Forecast
  • Crypto
    • Best Crypto Exchanges
    • Best Crypto Bots
    • Crypto Guides & Forecasts
No Result
View All Result
ForexEzy
No Result
View All Result
The World’s Leading Social Trading Platform
Try now
Home Forex Education Technical Analysis

Trading With Balance of Power Indicator

by Adam Stanley
December 9, 2021
in Technical Analysis
0
Trading With Balance of Power Indicator
0
SHARES
11
VIEWS
Share on FacebookShare on Twitter

The Balance of Power (BOP) indicator is an analysis tool created by Igor Livshin in August 2001. It tracks the price movement of assets in a given market and uses it to weigh the strength of buyers against that of sellers. In essence, it assesses the power of buyers versus that of sellers to help determine the likely price trajectory.  Additionally, it assesses the market’s health by comparing the combined strength of buyers and sellers.

We compute BOP as shown below:

BOP = (CLOSING PRICE – OPENING PRICE)/(HIGH PRICE – LOW PRICE) 

As may be seen from the equation:

  •  First, deduct the asset’s open price from the close price.
  •  Next, you find the difference between the asset’s highest and lowest price.
  • Third, you must divide the first result by the second result.
  • As the last step, compute the Simple Moving Average of all of the results obtained above.

However, you do not need to understand the methodology used to construct the indicator. A basic understanding of how the indication works is all that’s required instead.

The Best Forex Robots Report Is Already Here!
best forex robots
Check out 30+ best expert advisors with daily updated live results and statistics
Click Here

Uses of the BOP

For the most part, the BOP is utilized for three distinct objectives.

  • For determining the trend’s trajectory
  • When looking for potential trend changes or continuations
  • To profit from overbought and oversold market circumstances

Determining the trend’s trajectory

  • The direction of the BOP is typically a good predictor of the overall trend.
  • The trend is generally positive when the indicator rises.
  •  In most cases, when the indicator is declining, the trend is negative.
BOP Indicator on USDJPY daily price chart

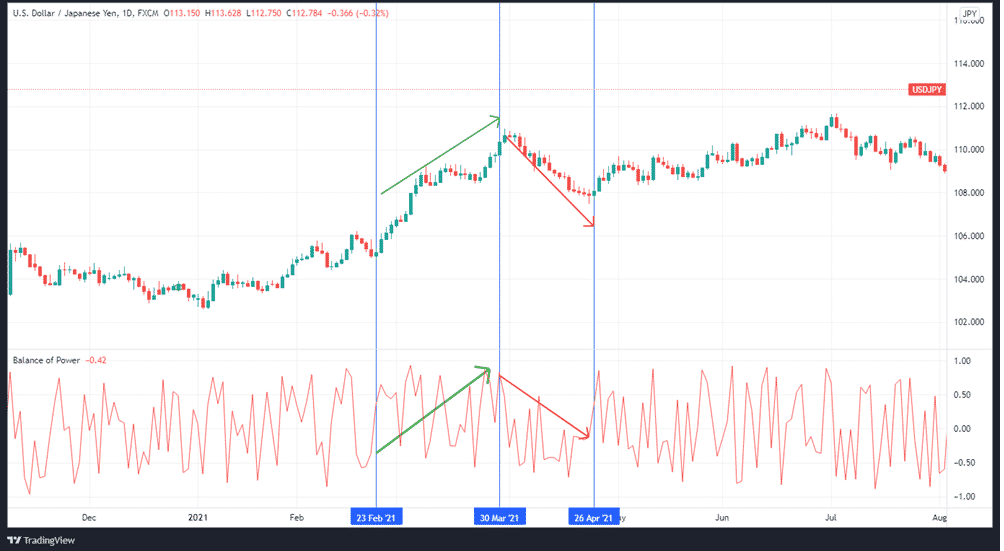
The chart above shows how the BOP confirms the trends.

How to spot trend reversals and continuations

  • In most cases, a divergence between price and the BoP signals an oncoming market reversal.
  • During a bullish divergence, the price registers lower lows while the BoP hits higher lows.
  • Positive divergence happens when price and BoP are at different levels. As long as the price and BoP indicator diverge, the present trend is likely to hold, 
  • When the price makes higher lows, and the BoP makes lower lows, there is a hidden bullish divergence.
  • The market is in a bearish divergence when prices are making lower highs, and the BoP is making higher highs.

The chart below shows a hidden negative divergence between the price and the BoP. 

BOP indicator on USDJPY daily price chart

Thereafter, we see a steady depreciation of the currency pair.

Overbought/oversold conditions

Overbought or oversold situations are existent when the BoP’s tops and bottoms form a cluster at either end of the spectrum. In order to maintain their long or short positions, experienced traders keep a watch on these clustered peaks or bottoms from the indicator.

BOP strategies

Using the indicator, traders can see how the price has changed over time. Balance of Power may be used to identify patterns, price divergences, as well as overbought and oversold conditions, much like any other oscillator.

  • Zero-line crossovers

Using zero-line crossovers, traders can see whether to buy or sell. By default, the BoP oscillates from -1 to +1, with point 0 as the midpoint/centerline. Zero-line crossovers show buy or sell signals since they signify a shift into either positive or negative territory. Signals are generated by crosses above and below the centerline.

Moving Averages are used to decrease the number of whipsaws in the data. Reduced responsiveness is a side effect of using a longer-period SMA.

The BoP’s primary signal comes from zero-line crosses; it may also be used to detect the trend, check for price divergences, and identify oversold/overbought assets.

  • In identifying trends

In technical analysis, an ascending BOP line suggests an upward trend, whereas a descending BOP line indicates a depreciating trend. The trend shift is confirmed by the crossing of the zero-line at the conclusion of the period.

  • Divergences

Whenever the BoP is out of synchronization with the market price, several issues arise. A negative divergence occurs when the price of an asset rises but the BOP does not; a positive divergence occurs when the price of an asset falls, but the BOP does not.

When the market is on an uptrend, it makes two higher peaks in quick succession. There is a higher peak, followed by a higher peak that is slightly lower.

This indicates that the trend is about to turn around. The same holds true for a downward trend. When you see a divergence in the trend, you should be prepared to enter a trade against it. Reversal of the trend is imminent.

BOP indicator on USDJPY daily price chart

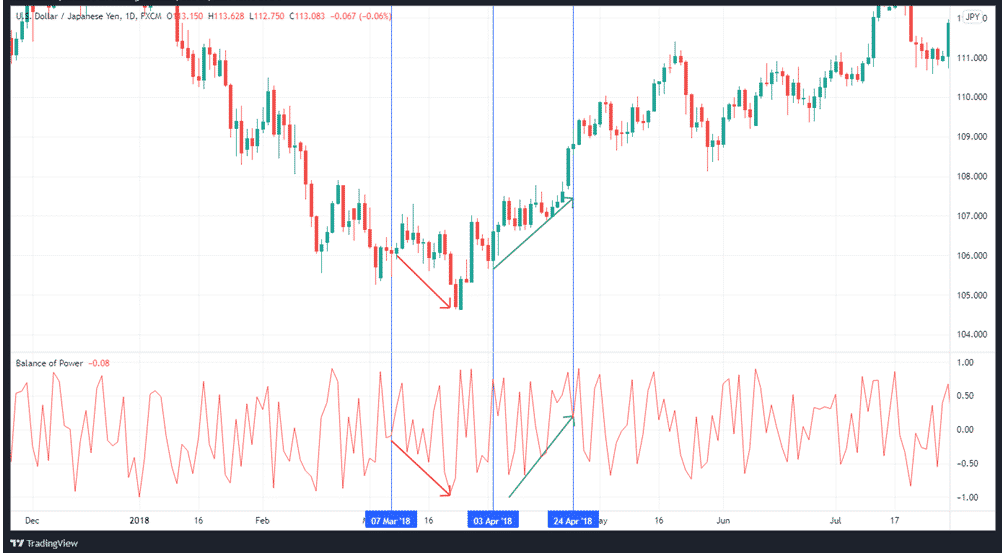
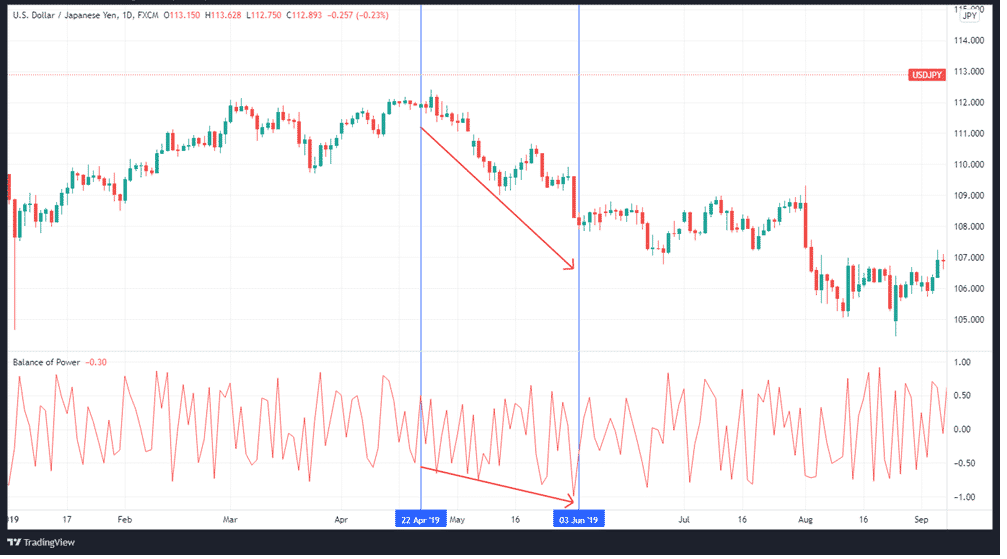
In the chart above, we can see how the price is in an uptrend as the BOP registers higher lows. Similarly, the price enters a downtrend when the BOP registers lower lows.

  • In overbought/oversold markets

In order to evaluate if a security is overbought or oversold, traders usually look at historical data for that asset. Look for dips that go beyond the established overbought/oversold thresholds for that asset. Using the BoP, traders can see how the price has changed over time.

Limitations of the BOP indicator

  • Its inside look at the distribution or accumulation is not a surety that traders will make profits if they initiate a long or short position on each signal supplied by the indicator.
  • It can indicate both bullish and bearish divergences, but they can also swiftly reverse once a trader initiates a position.

In summary

Traders can use the BoP indicator to get a sense of the market’s underlying activity. It demonstrates whether or not there is a surge in the systematic buying or selling activity in a particular asset.

The Best Forex Robots Report Is Already Here!
best forex robots
Check out 30+ best expert advisors with daily updated live results and statistics
Click Here
ShareTweet
Previous Post

DXY: US Dollar Index Forecast Ahead of Inflation Data

Next Post

GBPUSD – What Moves the Cable

Related Posts

What Are Pennant Chart Patterns in Forex: Step by Step Guide

What Are Pennant Chart Patterns in Forex: Step by Step Guide

by Chintan Patel
November 15, 2021
0

Continuation patterns in the forex market are a common occurrence whenever there is a large movement in one direction followed...

How To Trade Ascending Scallops in Forex

How To Trade Ascending Scallops in Forex

by Adam Stanley
November 10, 2021
0

Price in the Forex market does not always move in one direction. After a significant move in one direction, up...

Inverted Scallops in Forex Chart Patterns: Step by Step Guide

Inverted Scallops in Forex Chart Patterns: Step by Step Guide

by Adam Stanley
November 9, 2021
0

Whenever prices move up significantly in the forex market, exhaustion often kicks in. In most cases, the fatigue is usually...

Elder’s Method in Forex Trading

Elder’s Method in Forex Trading

by Tim Baudin
November 3, 2021
0

There are several strategies that traders and analysts have developed over the years, all in a bid to milk the...

Trading With Spinning Tops and Doji Candlestick Pattern

Trading With Spinning Tops and Doji Candlestick Pattern

by Tim Baudin
October 29, 2021
0

Japanese candlestick formations go hand-in-hand with various concepts related to chart analysis. Candlestick charts are popular among most of the...

Load More

Leave a Reply Cancel reply

Your email address will not be published. Required fields are marked *

Best Forex Automated Systems

  • TechBerry 9/10
  • Happy Galaxy 8.5/10
  • Forex Cyborg 8.5/10
  • Forex Fury 8/10
  • FXgoodway 7.5/10
  • Best Forex Brokers
  • Best Forex Robots
  • Best Forex Signals
  • Best Forex Managed Accounts

Top Trading Markets

We are dedicated to demystify the world of forex trading for you – no matter what level you are on.

Categories
  • Automated Trading
  • Cryptocurrency Trading
  • Day Trading
  • Forex Basics
  • Forex Brokers
  • Forex Education
  • Forex Forecasts
  • Forex Indicators
  • Forex Market Commentary
  • Forex Robots
  • Forex Signals
  • Forex Tools
  • Forex Trading Strategies
  • Forex VPS
  • Fundamental Analysis
  • Managed Accounts
  • Money Management
  • News
  • Risk Management
  • Social Trading
  • Technical Analysis
  • Top World Traders
  • Trading Apps
  • Trading Psychology
  • Uncategorized
Tags
arbitrage atr Avalanche AVAX Coin bollinger bands cci chart patterns classics copy trading courses Crypto day trading forex brokers forex charts forex ea forex education forex forecasting Forex Indicators forex software reviews grid trading hedging ichimoku macd market cycles news trading oscillators Polkadot price action trading rsi social trading SOL Solana strategies tips & tricks trading bots trading platforms trend trading Video
  • Terms of Use
  • Privacy Policy
  • Compensation Disclosure
  • Risk Disclosure
  • About Us
  • Contact Us

Copyright © 2023 by ForexEzy.com

No Result
View All Result
  • Top Forex Advisors
    • Best Forex Robots
    • Best Forex Signals
    • Best Managed Accounts
  • Top Forex Brokers
    • Best Forex Brokers
    • US Forex Brokers
    • UK Forex Brokers
    • MT4 Forex Brokers
    • MT5 Forex Brokers
    • Zero Spread Brokers
    • Best PayPal Brokers
    • TradingView Brokers
    • Social Trading Platforms
  • Getting Started
  • Forex Education
    • Forex Basics
    • Forex Trading Strategies
    • Money Management
    • Risk Management
    • Technical Analysis
    • Fundamental Analysis
    • Trading Psychology
    • Social Trading
    • Automated Trading
  • Forex Tools
    • Forex Robots
    • Forex Indicators
    • Forex Signals
    • Forex VPS
  • Forex Forecast
  • Crypto
    • Best Crypto Exchanges
    • Best Crypto Bots
    • Crypto Guides & Forecasts

© 2023, Forexezy. {copy} {year}