
Moving averages also called MAs in short, are the most widely used and oldest technical indicator used by traders because of its simplicity in both construction and uses.
It is among the “Lagging indicators” as it provides signals or direction of the price after a significant change in that direction.
Moving averages are very effective in the case of trend analysis as this indicator dampen short-term fluctuations and smoothen out the price so that a trader or analyst can focus on major or long-term price movement, due to this laggard.
It is also a very popular indicator as its signals are simple, clear and easy to understand.
Moving averages calculated by taking the close price of the currency pair, or you can choose open, high or low price instead of close price. Moving averages are simply the average price of the currency pair for last ‘X’ number of periods. It includes the new price data as it develops hence called moving averages.
Types of Moving Average
There are different types of moving averages, among them 2 types of moving averages are highly popular and widely use. They are,
- Simple Moving Averages (SMA)
- Exponential Moving Averages (EMA)
Simple Moving Averages (SMA) :
This is the based on the basic calculation of the moving average as mentioned above; by dividing the sum of the values of ‘X’ number of periods by the number of periods ‘X’. Because of its calculation method, it is simple and smoother than another type of moving averages.
You can choose any number as periods of any moving average, such as 10, 13, 15, 20, 25, 28, 30 etc. There are some numbers recommended in case of moving averages. Such as 10, 25, 30, 50, 100, 150 and 200; most of the traders use these periods of moving averages.
Calculation of SMA:
SMA of n periods = n period sum/n
n = the period or number of day’s you choose to plot moving averages. Such as 10,20 or 30.
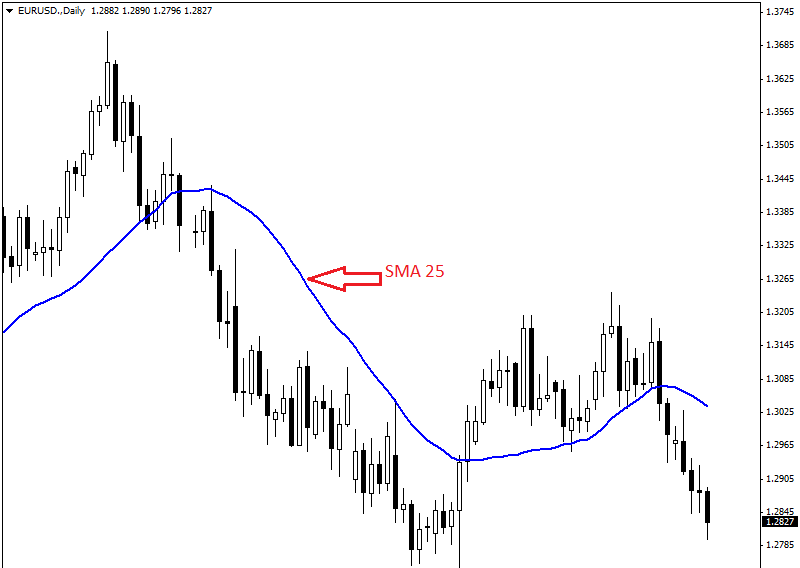
There is an example of simple moving average given in the chart above. We can see SMA25 or 25 day’s simple moving average (blue colored line) in the daily chart of EUR/USD.
Exponential Moving Averages (EMA):
Exponential Moving Averages also knew as EMAs. This type of moving averages designed and developed to reduce the lag or delaying nature of SMA by applying more weight on most recent price or data.
Calculation of EMA:
You have to go three steps to calculate the exponential moving average. First, you have to calculate the simple moving average of your chosen period. Then you have to calculate the weighting multiplier to put more weight in recent price data.
Then you can calculate the exponential moving average using simple moving average and weighting multiplier which you have calculated before. All three steps of calculation would be like this,
SMA = n period sum/n where n = number of periods chosen to calculate EMA
Multiplier = (2/ (n+1))
EMA = {Close – EMA (previous day)} x multiplier + EMA (previous day)
Here is an example of EMA in the chart given below,
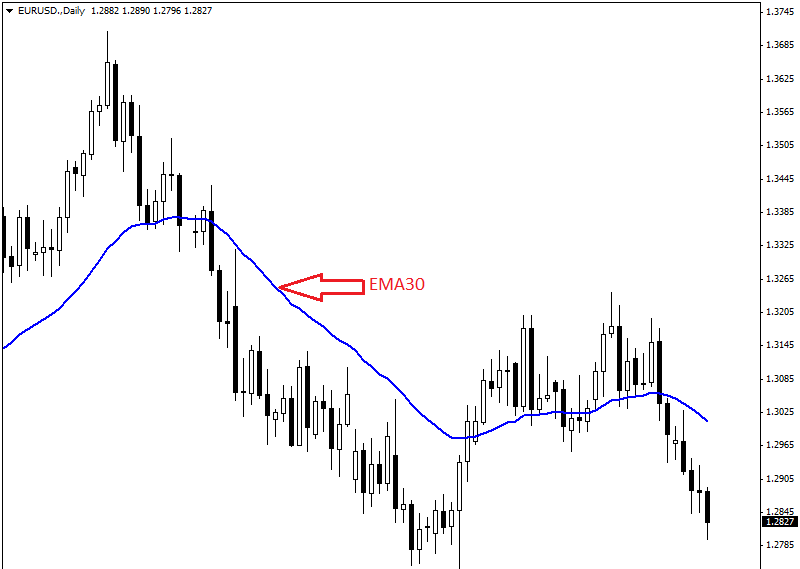
In the chart above, the blue colored line is 30 day’s exponential moving average (EMA30) on the daily chart of EUR/USD.
Simple Moving Averages (SMA) Vs Exponential Moving Averages (EMA) :
Calculation of SMA and EMA is different. Thus, there are some differences in their characteristics. The key difference is the lag factor. If same periods of moving average plotted, then we will be able to see a significant difference. Let’s check out the significant difference between SMA and EMA.
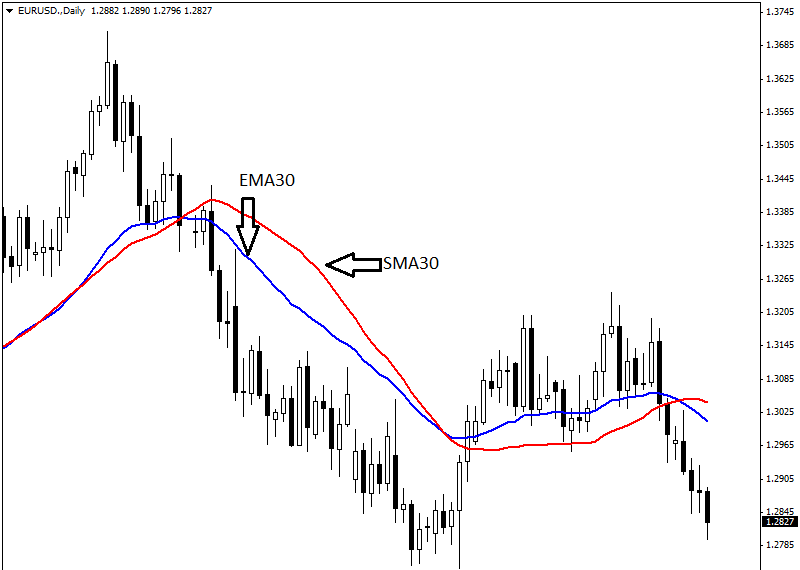
In the daily chart of EUR/USD, we have plotted SMA30 and EMA30. The red colored line is SMA30, and the blue colored line is EMA30. These two moving averages have a difference in appearance though they are of same periods. If you look at the chart carefully you will find that EMA reacts faster with the price than SMA reacts with the price.
This means EMA is faster and choppier than SMA. Thus, SMA is lazier but smoother than EMA. Both SMA and EMA are an effective tool. It depends on the trader who has to choose the type and period of moving average he/she will use depending on his/her trading style.
Trading with Moving Averages :
Moving averages can be used for various reasons. Such as,
- Trend Identification
- Trend Reversals
- Dynamic Support and Resistance
Trend Identification :
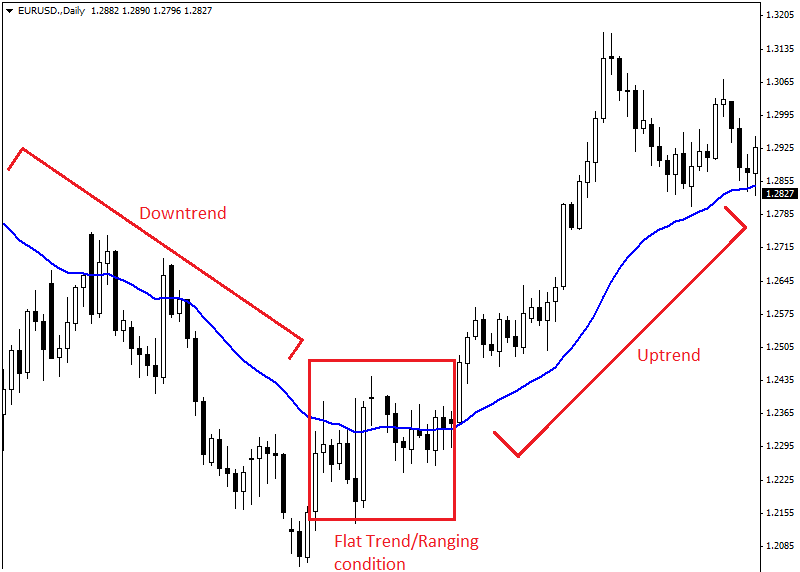
Moving averages are very useful to identify the trend and the direction of the trend. The trend is in an uptrend as price or candle is above the moving average. Inversely, if price/candle is below the moving average and the moving average is heading downward then the trend is a downtrend.
There is no valid trend (flat trend) if price or candle is in a range with moving average, and the moving average is flat. All these situations have shown in the chart of daily EUR/USD given below.
Trend Reversal:
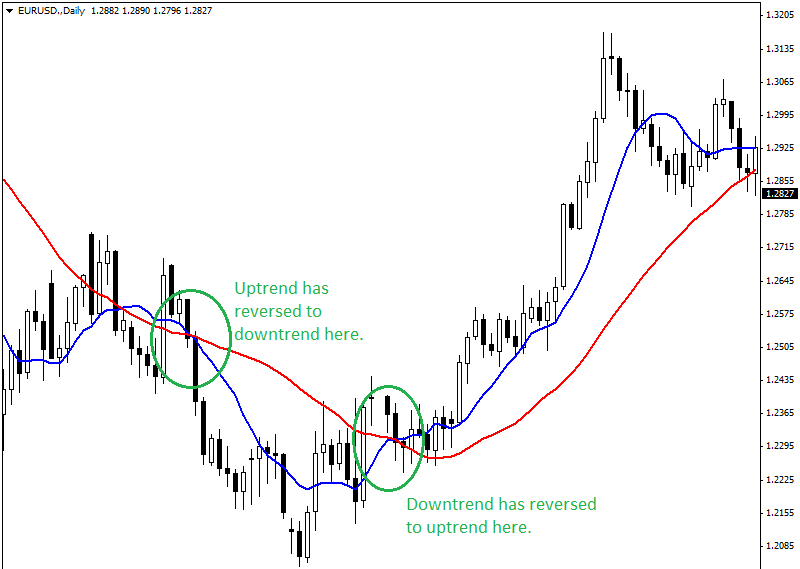
Trend reversals identified by the crossover between two or more moving averages of different periods. Let’s take two moving averages in consideration, SMA10 and SMA30. SMA10 is faster than SMA30 as its period is smaller than SMA30. When SMA10 crosses above SMA30 then it is a sign that trend has reversed to uptrend from the downtrend.
We should keep in mind that if short term moving average is below the long term moving average then the trend is down. And if the short-term moving average is above the long-term moving average then the trend is uptrend and if both moving averages stay at the same point then there is no or flat trend.
Now, when SMA10 crosses SMA30 from above then it is a confirmation that the trend has reversed to downtrend from uptrend. Both uptrend and downtrend reversals have shown in the example in the daily chart of EUR/USD given below.
Dynamic Support and Resistance:
In an uptrend price tends to get support whenever its price or candle comes near moving average. Thus, most of the times price bounces back to its previous trend from the moving average. This scenario is a bullish pullback.
Inversely, when a currency pair is in downtrend then it tends to get resistance when price or candle comes near moving average. Thus, price tends to bounce back to downward from this moving average. This is a bearish pullback. Both bullish and bearish pullback has shown in the example chart of daily EUR/USD given below.
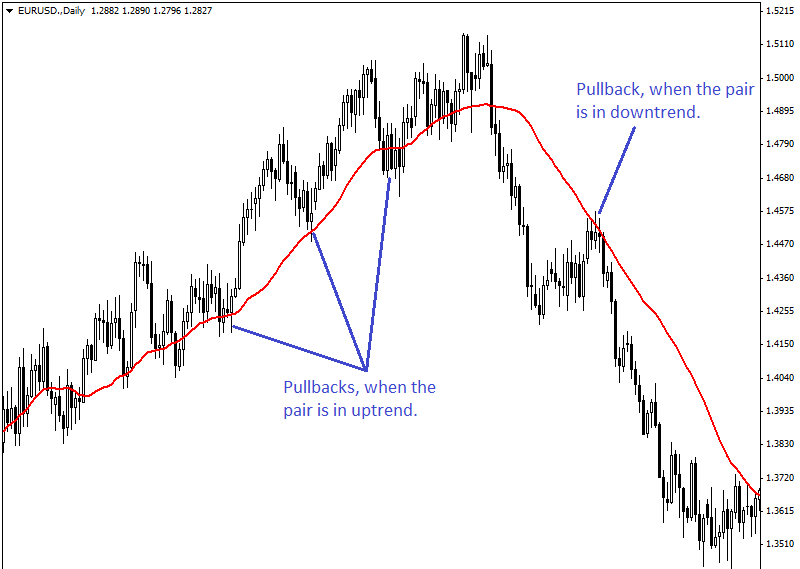
In this way, moving averages can be used as dynamic support and resistances.
Conclusion:
All the methods of using moving average are very useful for trend identification. Moving average crossover signals should be used only for trend identification. Trading crossover signals might make you depressed as these are late signals and can provide many whipsaws.
Trading the pullbacks near the moving averages is a very effective strategy. However, other momentum indicators or oscillators should be used with moving averages to make a better combination to provide entry signals.


