ForexEzy
No Result
View All Result
  • Home
  • Getting Started with Forex
  • Forex Education
    • Forex Basics
    • Forex Trading Strategies
    • Money Management
    • Risk Management
    • Technical Analysis
    • Fundamental Analysis
    • Trading Psychology
    • Social Trading
    • Automated Trading
  • Forex Tools
    • Forex Robots
    • Forex Indicators
    • Forex Signals
  • Top Forex Brokers
  • Top Forex Robots
  • Commentary
  • Blog
No Result
View All Result
ForexEzy
No Result
View All Result
Home Forex Education Technical Analysis

Trading Forex Using Price Channels

by Tim Baudin
September 6, 2016
in Technical Analysis
0
Trading Forex Using Price Channels
0
SHARES
11
VIEWS
Share on FacebookShare on Twitter

Price channel indicator is a volatility indicator which is similar to Bollinger bands. This indicator appears as two lines set above and below the price of a currency pair or other trading instruments.

https://youtu.be/Snz33Od6l5Q

The upper line/upper band is fundamentally the high point or price of n-number of periods.

Inversely, the lower line/lower band is the low point or price of n-number of periods.

Price-channel-indicator

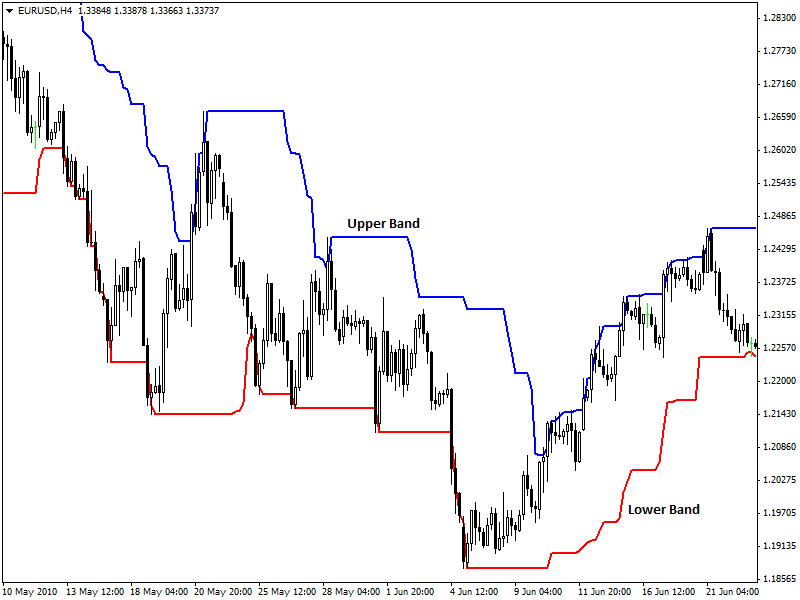
4-hour chart of EUR/USD is showing a price channel with its upper band and lower band.

Calculation:

The default period for this indicator is 20. Calculation of this indicator has given below,

Upper Line/Upper Band = 20 days highest price

Lower line/Lower Band = 20 days lowest price

Interpretation:

Price channel indicator can serve various purposes. This indicator can detect both trend reversal and continuation. Trend reversal identified as soon as price breaks or thrusts the upper band and lower band. In bullish reversals, price/candlestick thrusts the upper band after a prolonged downtrend.

Inversely, price thrusts the lower band in case of the bearish trend reversal. In bullish reversals,  traders take long positions. Traders take short positions as soon as they find bearish reversals.

breakout-and-breakdown

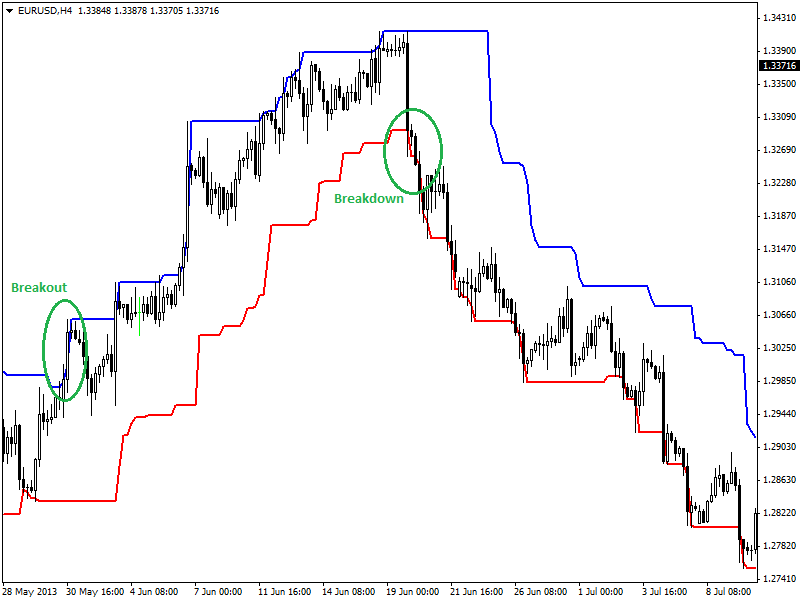
4-hour chart of EUR/USD is showing breakout and breakdown. Breakout is the first confirmation of a bullish trend reversal and occurs as soon as a bullish candlestick thrust the upper band of the price channel. The breakdown is the first confirmation of downtrend which occurs as soon as a bearish candlestick thrusts the lower band.

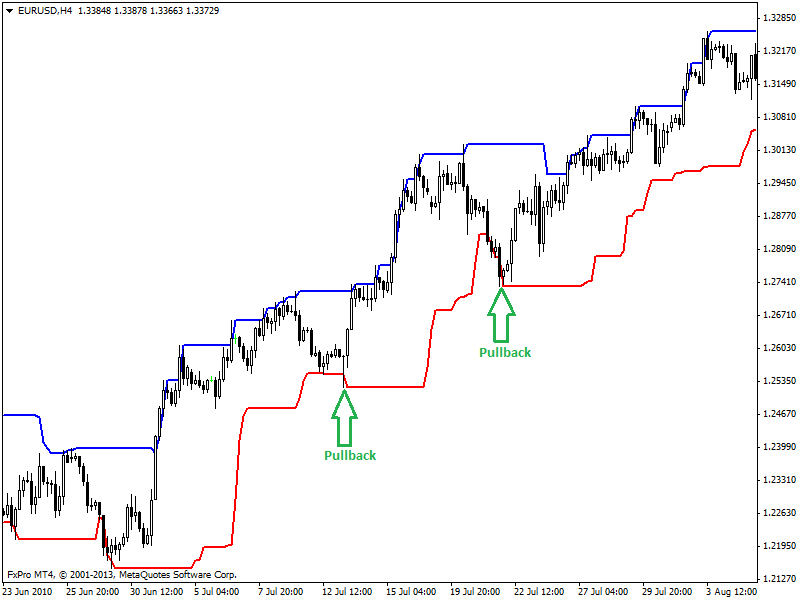
Sometimes price or candlesticks hit or thrust the upper or lower bands and immediately reverse to its previous trend direction. This scenario is called pullback which indicates possible trend continuation. The pullback in an uptrend indicates that the price will bounce back to upward direction again.

The pullback in a downtrend indicates bearish trend continuation. Here is an example showing pullbacks in a 4-hour chart of EUR/USD (given below).

Pullback

Other indicators such as MACD, Stochastic indicator can be useful to generate buy and sell signals during pullbacks.

Summary:

Price channel is effective and popular for trend following trading strategies. Price channel can detect breakouts and breakdowns easily. Candlestick should be bullish during breakout and candlestick should be bearish during the breakdown.

Bullish breakout with a weak candlestick and bearish breakout with a strong or bearish candle should be avoided as these are mostly fake-outs or failed breakouts. Traders should avoid fake-outs to achieve better trading performance.

ShareTweet
Previous Post

Volatility Indicators – Bollinger Bands Explained

Next Post

Understanding Moving Averages

Related Posts

An Introduction To Forex Indicators

An Introduction To Forex Indicators

by Chintan Patel
January 1, 2021
0

What are the Forex indicators? A vast part of technical analysis is understanding and trading with these tools. Although they...

Using Trendlines and Saucer Formations in Trading

Using Trendlines and Saucer Formations in Trading

by Tim Baudin
December 21, 2020
0

Trendlines are those lines that you can recognize easily. A trader draws trendlines on charts in order to connect a...

RSI - Top 3 Real Charts You've Missed

RSI – Top 3 Real Charts You’ve Missed

by Tim Baudin
December 17, 2020
0

Overview Are you still doubting the power of the RSI? This article will cover three recent forex trading opportunities mostly...

The Trading Indicator You Have not Heard of – The Williams %R

The Trading Indicator You Have not Heard of – The Williams %R

by Adam Stanley
December 1, 2020
0

The Williams Percentage Range is a highly effective tool that measures price variations over a period of time for various...

How to Use Technical Analysis in the Market?

How To Use Technical Analysis In The Market?

by Adam Stanley
November 25, 2020
0

If you are trading in the market, you’ll know that uncertainty and risk lurk at every step. In such a...

Load More

Best Forex EA

  • ROFX 9/10
  • Forex Fury 8/10
  • FXgoodway 7.5/10
  • Z Trader FX EA 7/10
  • Forex Incontrol Reborn 6.5/10

Popular News

  • The Best RSI and CCI Combination Trading Strategy for Optimum Returns

    The Best RSI and CCI Combination Trading Strategy for Optimum Returns

    2 shares
    Share 2 Tweet 0
  • Rofx Review – High Profitability and Stable Performance Analysis

    29 shares
    Share 29 Tweet 0
  • The Best Forex Scalping Strategy – Using 3 Popular Technical Indicators

    0 shares
    Share 0 Tweet 0
  • The Best MT4 Indicators & Expert Advisors For Forex Trading

    2 shares
    Share 2 Tweet 0
  • How to check if the indicator is repainting?

    2 shares
    Share 2 Tweet 0

Trading

Footer

We are dedicated to demystify the world of forex trading for you – no matter what level you are on.

Categories
  • Automated Trading
  • Day Trading
  • Forex Basics
  • Forex Brokers
  • Forex Education
  • Forex Forecasts
  • Forex Indicators
  • Forex Market Commentary
  • Forex Robots
  • Forex Signals
  • Forex Tools
  • Forex Trading Strategies
  • Fundamental Analysis
  • Money Management
  • News
  • Risk Management
  • Social Trading
  • Technical Analysis
  • Top World Traders
  • Trading Psychology
  • Uncategorized
Tags
arbitrage atr bollinger bands cci chart patterns classics copy trading courses day trading forex brokers forex charts forex ea forex education forex forecasting Forex Indicators forex software reviews grid trading hedging ichimoku macd market cycles news trading oscillators price action trading rsi social trading strategies tips & tricks trading bots trading platforms trend trading Video
  • Terms of Use
  • Privacy Policy
  • Compensation Disclosure
  • Risk Disclosure
  • About Us
  • Contact Us

Copyright © 2020 by ForexEzy.com

No Result
View All Result
  • Home
  • Getting Started with Forex
  • Forex Education
    • Forex Basics
    • Forex Trading Strategies
    • Money Management
    • Risk Management
    • Technical Analysis
    • Fundamental Analysis
    • Trading Psychology
    • Social Trading
    • Automated Trading
  • Forex Tools
    • Forex Robots
    • Forex Indicators
    • Forex Signals
  • Top Forex Brokers
  • Top Forex Robots
  • Commentary
  • Blog

© 2020, Forexezy.