ForexEzy
No Result
View All Result
  • Top Forex Advisors
    • Best Forex Robots
    • Best Forex Signals
    • Best Managed Accounts
  • Top Forex Brokers
    • Best Forex Brokers
    • US Forex Brokers
    • UK Forex Brokers
    • MT4 Forex Brokers
    • MT5 Forex Brokers
    • Zero Spread Brokers
    • Best PayPal Brokers
    • TradingView Brokers
    • Social Trading Platforms
  • Top Review Platforms
  • Forex Education
    • Getting Started
    • Forex Basics
    • Forex Trading Strategies
    • Money Management
    • Risk Management
    • Technical Analysis
    • Fundamental Analysis
    • Trading Psychology
    • Social Trading
    • Automated Trading
  • Forex Tools
    • Forex Robots
    • Forex Indicators
    • Forex Signals
    • Forex VPS
  • Forex Forecast
  • Crypto
    • Best Crypto Exchanges
    • Best Crypto Bots
    • Crypto Guides & Forecasts
No Result
View All Result
ForexEzy
No Result
View All Result
The World’s Leading Social Trading Platform
Try now
Home Forex Education Technical Analysis

Volatility Indicators – Bollinger Bands Explained

by Tim Baudin
September 6, 2016
in Technical Analysis
0
0
SHARES
11
VIEWS
Share on FacebookShare on Twitter

Bollinger band is a volatility indicator developed by John Bollinger. This indicator measures volatility based on standard deviation. Bollinger band is most used volatility indicator and one of the widely used indicators in technical analysis.


Calculation:

Calculation of Bollinger band is based on a simple moving average. The default period of Bollinger band and moving average is 20. However, many traders use Bollinger bands of 15 or 25 periods. The calculation of Bollinger band is as follows,

Middle Band = 20 day SMA or Simple Moving Average

Upper Band = 20 day SMA + (20 day Standard Deviation)

Lower Band = 20 days SMA – (20 day Standard Deviation)

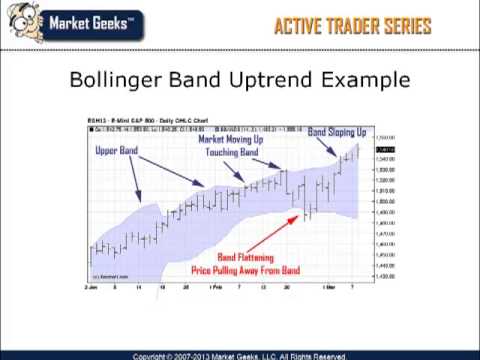
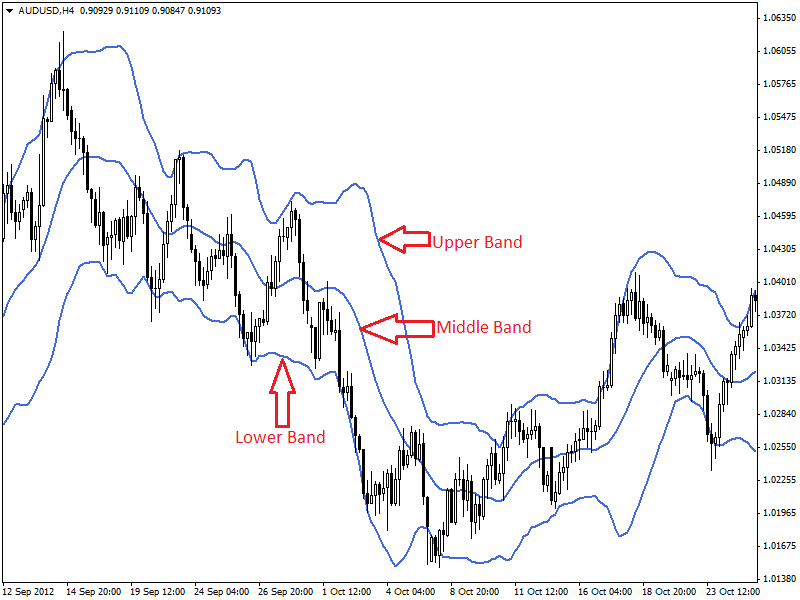
Bollinger band appears as a band consists of 3 moving averages like lines. Here is an example chart containing Bollinger bands.

Bollinger-bands-1

Interpretation:

Bollinger band can be used in many ways. Different traders use this indicator in different ways. Such as,

  1. Bollinger Band Bounce
  2. Bollinger Band Squeeze
  3. Bollinger Band Breakout

Bollinger Band Bounce:

This is very simple and effective trading method for short term trading. Traders usually use this for short term trading or scalping in the forex market. This strategy involves buying when candlestick hit the lower Bollinger band and selling when candlestick hit upper Bollinger band.

It is better if you follow the trend while trading Bollinger band bounces.

Bollinger-Band-Bounce

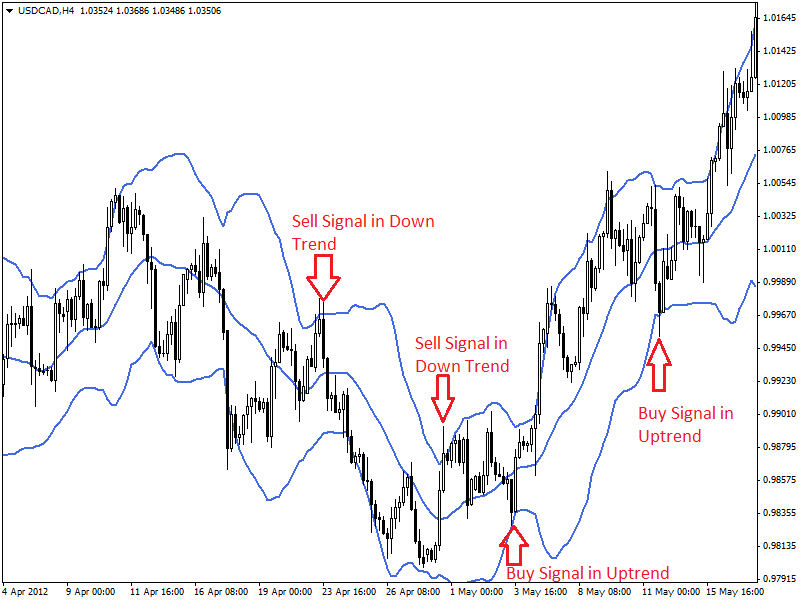
4-hour chart of USD/CAD is showing several entry signals for both long and short positions.

Bollinger Band Squeeze:

When a currency pair becomes less volatile, Bollinger band becomes squeezed. In squeezed condition, the distance between upper, lower and middle bands becomes narrow. This scenario occurs when the price of the pair is ranging in a narrow range.

This indicates low volatility and a sign of a breakout or breakdown. Squeezed Bollinger band after a prolonged downtrend indicates accumulation period. Inversely squeezed Bollinger band after a prolonged uptrend indicates distribution period. But it is extremely difficult to identify accumulation and distribution phase properly.

This is why traders usually add other indicators to understand the possible price direction after the squeezed state.

Bollinger-Band-Squeeze

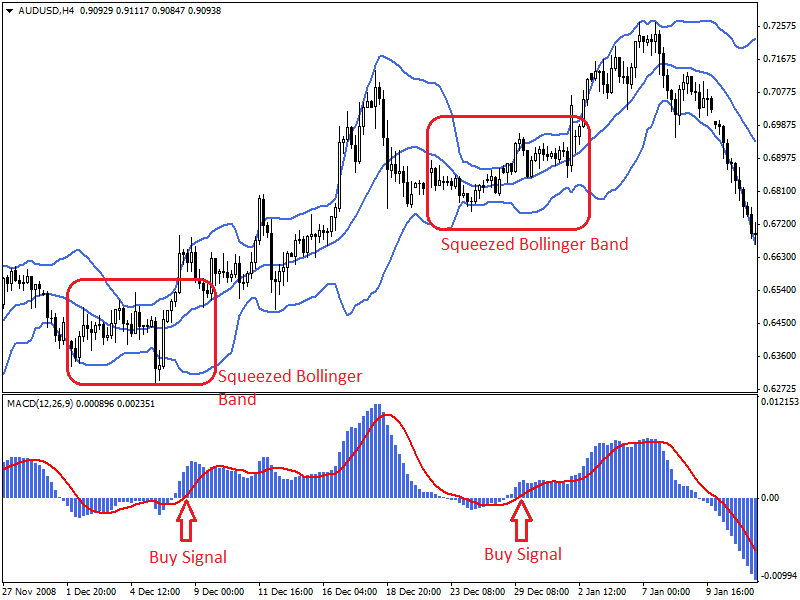
On the 4 hour chart of AUD/USD, we can see entry signals for long positions as Bollinger band was squeezed and MACD moved above the zero line.

4-hour-chart-of-AUDUSD

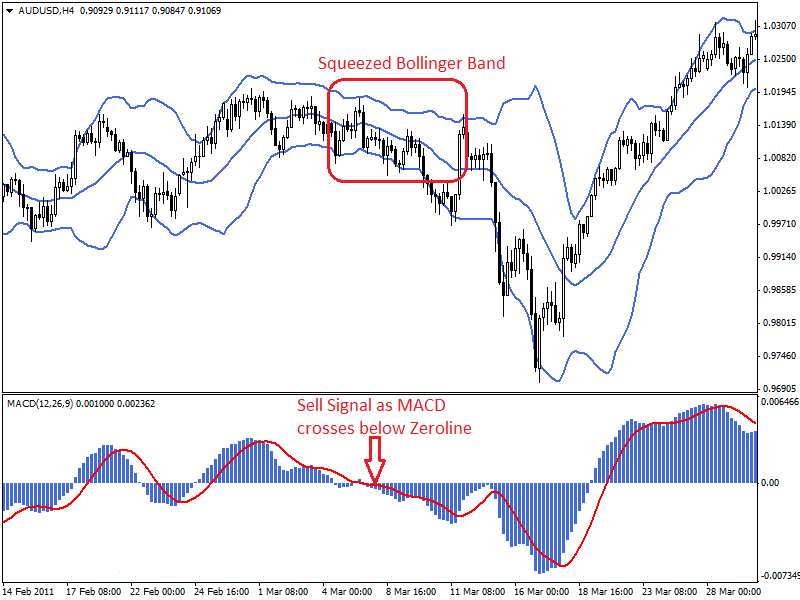
4-hour chart of AUD/USD (given above) is showing sell signal or entry signal for long position when the Bollinger band was squeezed and MACD crosses below the zero line/center line.

Bollinger Band Breakout:

A breakout occurs when candlesticks hit upper or lower Bollinger band. Breakouts and breakdowns mostly occur after a squeezed state of the Bollinger band. A squeezed condition of Bollinger band indicates the possibility of a breakout or breakdown.

Thus, traders generally trade breakouts or breakdowns after Bollinger band squeeze.

Bollinger-Band-Breakout

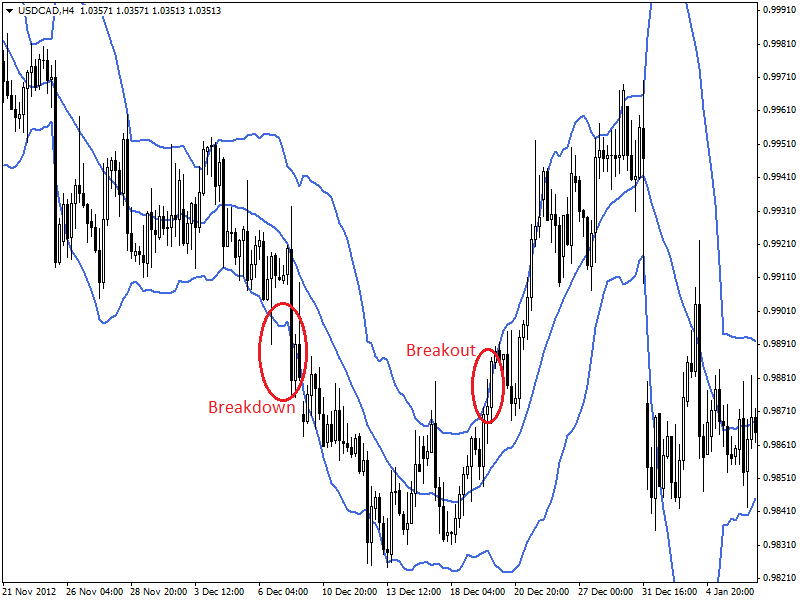
4-hour chart of USD/CAD is showing breakout and breakdown after a squeezed state of the Bollinger band.

Summary:

Volatility plays a vital role in Bollinger band trading strategies. Such as, Bollinger band bounce strategy works well when there is a confirmed trend and volatility is high. Breakouts and breakdowns carry more success if found after a prolonged squeeze state of the Bollinger band.

Traders should consider these factors while trading with Bollinger bands.

The Best Forex Robots Report Is Already Here!
best forex robots
Check out 30+ best expert advisors with daily updated live results and statistics
Click Here
The Best Forex Robots Report Is Already Here!
best forex robots
Check out 30+ best expert advisors with daily updated live results and statistics
Click Here
ShareTweet
Previous Post

Theory of Gaps

Next Post

Trading Forex Using Price Channels

Related Posts

Trading With Balance of Power Indicator

Trading With Balance of Power Indicator

by Adam Stanley
December 9, 2021
0

The Balance of Power (BOP) indicator is an analysis tool created by Igor Livshin in August 2001. It tracks the...

What Are Pennant Chart Patterns in Forex: Step by Step Guide

What Are Pennant Chart Patterns in Forex: Step by Step Guide

by Chintan Patel
November 15, 2021
0

Continuation patterns in the forex market are a common occurrence whenever there is a large movement in one direction followed...

How To Trade Ascending Scallops in Forex

How To Trade Ascending Scallops in Forex

by Adam Stanley
November 10, 2021
0

Price in the Forex market does not always move in one direction. After a significant move in one direction, up...

Inverted Scallops in Forex Chart Patterns: Step by Step Guide

Inverted Scallops in Forex Chart Patterns: Step by Step Guide

by Adam Stanley
November 9, 2021
0

Whenever prices move up significantly in the forex market, exhaustion often kicks in. In most cases, the fatigue is usually...

Elder’s Method in Forex Trading

Elder’s Method in Forex Trading

by Tim Baudin
November 3, 2021
0

There are several strategies that traders and analysts have developed over the years, all in a bid to milk the...

Load More

Best Forex Automated Systems

  • TechBerry 9/10
  • Happy Galaxy 8.5/10
  • Forex Cyborg 8.5/10
  • Forex Fury 8/10
  • FXgoodway 7.5/10
  • Best Forex Brokers
  • Best Forex Robots
  • Best Forex Signals
  • Best Forex Managed Accounts

Top Trading Markets

We are dedicated to demystify the world of forex trading for you – no matter what level you are on.

Categories
  • Automated Trading
  • Crypto Robot Review
  • Cryptocurrency Trading
  • Day Trading
  • Forex Basics
  • Forex Brokers
  • Forex Education
  • Forex Forecasts
  • Forex Indicators
  • Forex Market Commentary
  • Forex Robots
  • Forex Signals
  • Forex Signals
  • Forex Tools
  • Forex Trading Strategies
  • Forex VPS
  • Fundamental Analysis
  • Managed Accounts
  • Money Management
  • News
  • Review
  • Review Platforms
  • Risk Management
  • Social Trading
  • Technical Analysis
  • Top World Traders
  • Trading Apps
  • Trading Psychology
  • Uncategorized
Tags
Acquisition AI Amazon Apple Artificial Intelligence Bitcoin bond yields CEO China earnings earnings report economy Electric Vehicles Federal Reserve financial performance Financial Results forex ea forex software reviews Growth Guidance Housing Market inflation interest rates Investing investment Investors Market Volatility merger mortgage rates net profit Nvidia Oil prices Q2 Results revenue Revenue Growth Sales sales growth Stock Futures stock market stock performance Stocks strategies technology Tesla Video
  • Terms of Use
  • Privacy Policy
  • Compensation Disclosure
  • Risk Disclosure
  • About Us
  • Contact Us

Copyright © 2023 by ForexEzy.com

No Result
View All Result
  • Top Forex Advisors
    • Best Forex Robots
    • Best Forex Signals
    • Best Managed Accounts
  • Top Forex Brokers
    • Best Forex Brokers
    • US Forex Brokers
    • UK Forex Brokers
    • MT4 Forex Brokers
    • MT5 Forex Brokers
    • Zero Spread Brokers
    • Best PayPal Brokers
    • TradingView Brokers
    • Social Trading Platforms
  • Top Review Platforms
  • Forex Education
    • Getting Started
    • Forex Basics
    • Forex Trading Strategies
    • Money Management
    • Risk Management
    • Technical Analysis
    • Fundamental Analysis
    • Trading Psychology
    • Social Trading
    • Automated Trading
  • Forex Tools
    • Forex Robots
    • Forex Indicators
    • Forex Signals
    • Forex VPS
  • Forex Forecast
  • Crypto
    • Best Crypto Exchanges
    • Best Crypto Bots
    • Crypto Guides & Forecasts

© 2023, Forexezy. {copy} {year}