ForexEzy
No Result
View All Result
  • Home
  • Getting Started with Forex
  • Forex Education
    • Forex Basics
    • Forex Trading Strategies
    • Money Management
    • Risk Management
    • Technical Analysis
    • Fundamental Analysis
    • Trading Psychology
    • Social Trading
    • Automated Trading
  • Forex Tools
    • Forex Robots
    • Forex Indicators
    • Forex Signals
  • Top Forex Brokers
  • Top Forex Robots
  • Commentary
  • Blog
No Result
View All Result
ForexEzy
No Result
View All Result
Home Forex Education Technical Analysis

Theory of Gaps

by Tim Baudin
September 6, 2016
in Technical Analysis
0
Theory of Gaps
0
SHARES
11
VIEWS
Share on FacebookShare on Twitter

Gaps are specific candlestick pattern and generally occur when there is a significant gap between two candles. In this case, the low and open price remains higher than the high and close price of the previous candle.

Gaps generally represent extreme conditions during any news release or price sensitive information.

Gaps are profitable as the price movement is very sharp during gap formation. Here is an example showing a bearish gap in the candlestick,

Theory-of-Gap

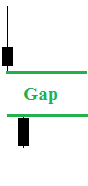
In the bullish gap, low price of the current candle would be higher than the high price of the previous candle. In the bearish gap, the high price of the current candle would be lower than the low price of the previous candle.

Types of Gap:

There are different types of the gap. These are as follows,

  • Breakaway Gaps
  • Exhaustion Gaps
  • Common Gaps
  • Continuation Gaps

Breakaway Gaps:

This pattern is generally found during breakout or breakdown. This pattern can be taken as the buy or sell signal which is the beginning of a new trend. If this pattern is found during a breakout of resistance line, then it is considered as a bullish candle. This scenario indicates a highly possible bullish trend.

Breakaway-Gaps

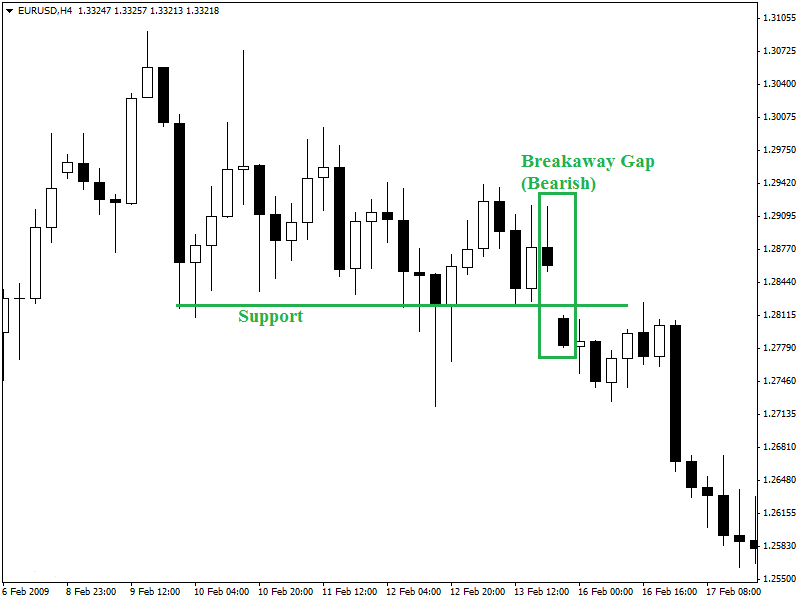
4-hour chart of EUR/USD (given above) is showing a bearish breakaway gap. This gap occurred during the breakdown of the support line. This breakaway gap should be considered as an entry signal for a short position.

Exhaustion Gaps:

This type of gap generally found after a prolonged up or down trend. This pattern exposes the extreme up or down move and indicates a possible reversal. Traders get into a long position as they find an exhaustion gap pattern after a prolonged downtrend.

Inversely, an exhaustion gap after a prolonged downtrend would be an entry signal for a short position.

Exhaustion-Gaps

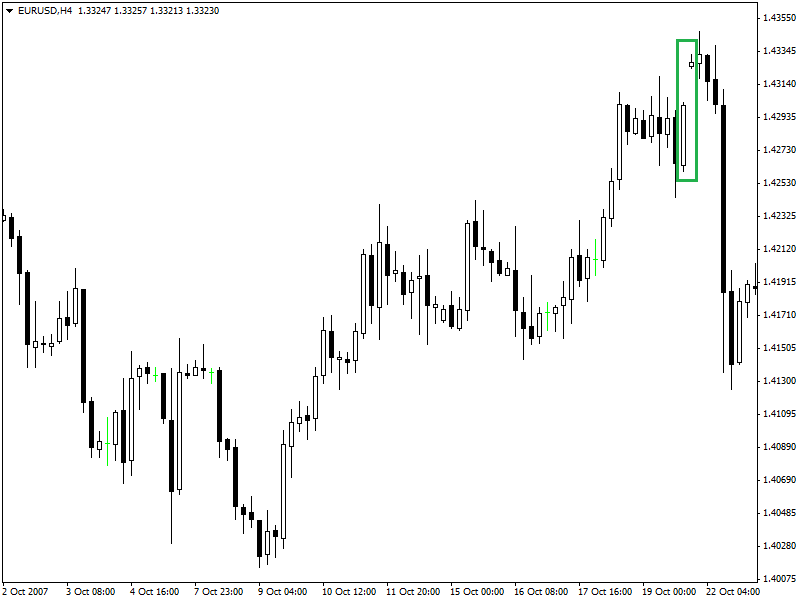
4-hour chart of EUR/USD is showing an example of exhaustion gap which has found at the end of an uptrend. This is a reversal and an entry signal for a short position.

Common Gaps:

These gaps are neither breakaway nor exhaustion gaps. These gaps are not considered as patterns. The distance between two candlesticks confirms this type of gap. Traders usually do not trade or take any decision based on this gap.

Common-Gaps

4-hour EUR/USD chart is showing a common gap as there was a distance between two candlesticks.

Continuation Gaps:

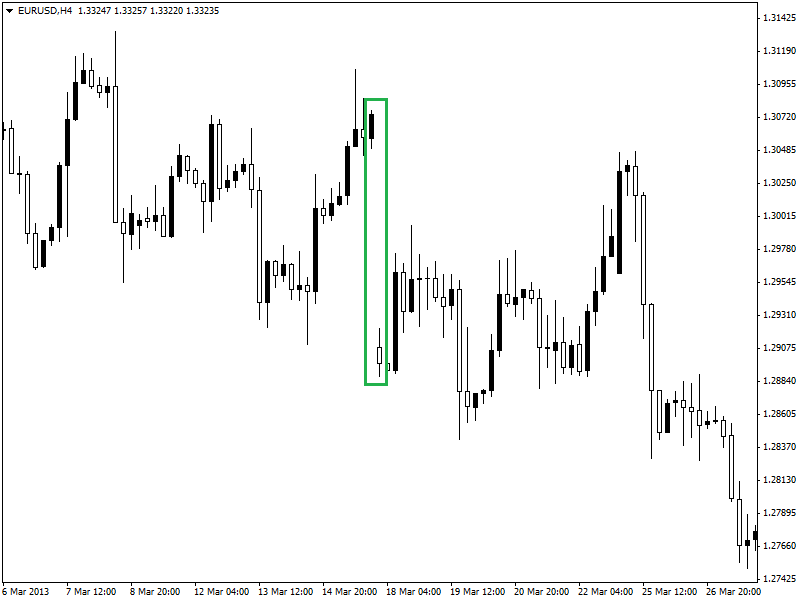
This type of gap is found in the middle of chart pattern and indicates the possible continuation of the current trend. Continuation gap in an uptrend indicates the possibility of the continuation of the uptrend.

Inversely, in a downtrend, a continuation pattern indicates a possible continuation of the prevailing trend.

Continuation-Gaps


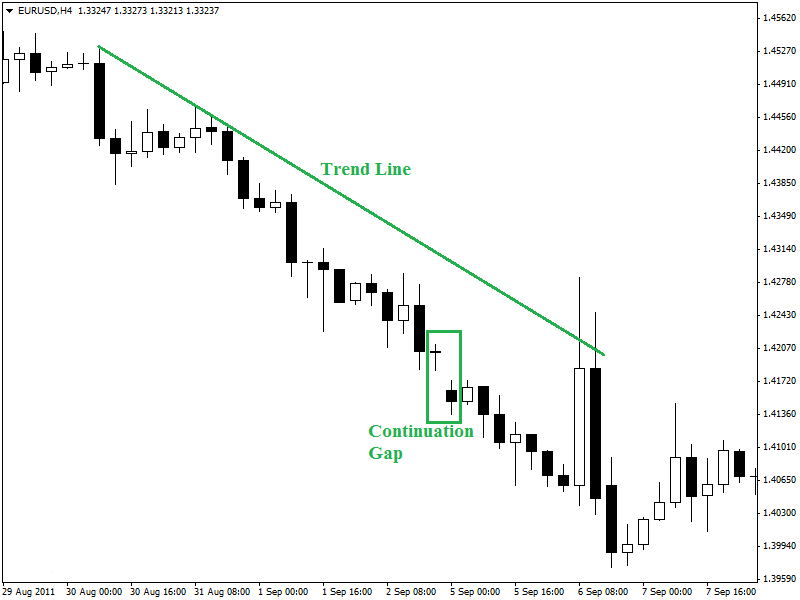
4-hour chart of EUR/USD (given above) is showing a continuation gap pattern as it was found in a downtrend. Due to this bearish continuation gap, the price of this pair has suffered further fall after the pattern formed.

Summary:

Trading the gaps is an effective trading strategy. Traders should use defined stop loss, profit target, and other money management tools. A disciplined approach is a must requirement for any kind of successful trading.

ShareTweet
Previous Post

Continuation Pattern – Flags and Pennants

Next Post

Volatility Indicators – Bollinger Bands Explained

Related Posts

An Introduction To Forex Indicators

An Introduction To Forex Indicators

by Chintan Patel
January 1, 2021
0

What are the Forex indicators? A vast part of technical analysis is understanding and trading with these tools. Although they...

Using Trendlines and Saucer Formations in Trading

Using Trendlines and Saucer Formations in Trading

by Tim Baudin
December 21, 2020
0

Trendlines are those lines that you can recognize easily. A trader draws trendlines on charts in order to connect a...

RSI - Top 3 Real Charts You've Missed

RSI – Top 3 Real Charts You’ve Missed

by Tim Baudin
December 17, 2020
0

Overview Are you still doubting the power of the RSI? This article will cover three recent forex trading opportunities mostly...

The Trading Indicator You Have not Heard of – The Williams %R

The Trading Indicator You Have not Heard of – The Williams %R

by Adam Stanley
December 1, 2020
0

The Williams Percentage Range is a highly effective tool that measures price variations over a period of time for various...

How to Use Technical Analysis in the Market?

How To Use Technical Analysis In The Market?

by Adam Stanley
November 25, 2020
0

If you are trading in the market, you’ll know that uncertainty and risk lurk at every step. In such a...

Load More

Best Forex EA

  • ROFX 9/10
  • Forex Fury 8/10
  • FXgoodway 7.5/10
  • Z Trader FX EA 7/10
  • Forex Incontrol Reborn 6.5/10

Popular News

  • The Best RSI and CCI Combination Trading Strategy for Optimum Returns

    The Best RSI and CCI Combination Trading Strategy for Optimum Returns

    2 shares
    Share 2 Tweet 0
  • Rofx Review – High Profitability and Stable Performance Analysis

    29 shares
    Share 29 Tweet 0
  • The Best Forex Scalping Strategy – Using 3 Popular Technical Indicators

    0 shares
    Share 0 Tweet 0
  • The Best MT4 Indicators & Expert Advisors For Forex Trading

    2 shares
    Share 2 Tweet 0
  • How to check if the indicator is repainting?

    2 shares
    Share 2 Tweet 0

Trading

Footer

We are dedicated to demystify the world of forex trading for you – no matter what level you are on.

Categories
  • Automated Trading
  • Day Trading
  • Forex Basics
  • Forex Brokers
  • Forex Education
  • Forex Forecasts
  • Forex Indicators
  • Forex Market Commentary
  • Forex Robots
  • Forex Signals
  • Forex Tools
  • Forex Trading Strategies
  • Fundamental Analysis
  • Money Management
  • News
  • Risk Management
  • Social Trading
  • Technical Analysis
  • Top World Traders
  • Trading Psychology
  • Uncategorized
Tags
arbitrage atr bollinger bands cci chart patterns classics copy trading courses day trading forex brokers forex charts forex ea forex education forex forecasting Forex Indicators forex software reviews grid trading hedging ichimoku macd market cycles news trading oscillators price action trading rsi social trading strategies tips & tricks trading bots trading platforms trend trading Video
  • Terms of Use
  • Privacy Policy
  • Compensation Disclosure
  • Risk Disclosure
  • About Us
  • Contact Us

Copyright © 2020 by ForexEzy.com

No Result
View All Result
  • Home
  • Getting Started with Forex
  • Forex Education
    • Forex Basics
    • Forex Trading Strategies
    • Money Management
    • Risk Management
    • Technical Analysis
    • Fundamental Analysis
    • Trading Psychology
    • Social Trading
    • Automated Trading
  • Forex Tools
    • Forex Robots
    • Forex Indicators
    • Forex Signals
  • Top Forex Brokers
  • Top Forex Robots
  • Commentary
  • Blog

© 2020, Forexezy.