Flags and pennants are very effective and profitable continuation chart patterns. These two chart patterns found after a sharp price movement. These patterns require a short time to develop rather than other chart patterns.
Flag Pattern :
In flag pattern, there will be a rectangle sloping in the opposite direction of the prevailing trend. Price movement of the prevailing trend often called pole of this flag pattern which helps us to measure minimum future price movement from the breakout point. A figure of this flag pattern has given below,
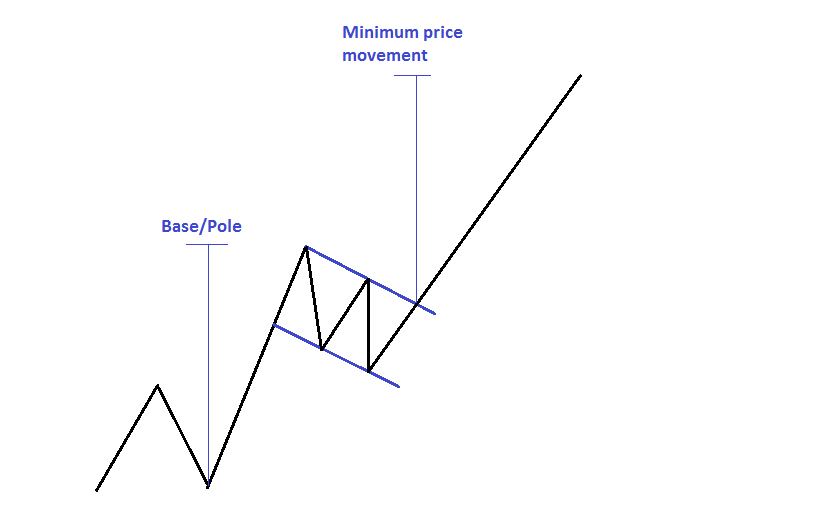
Now let’s take a look at an example of flag pattern in the technical chart of EUR/USD (daily chart) given below.
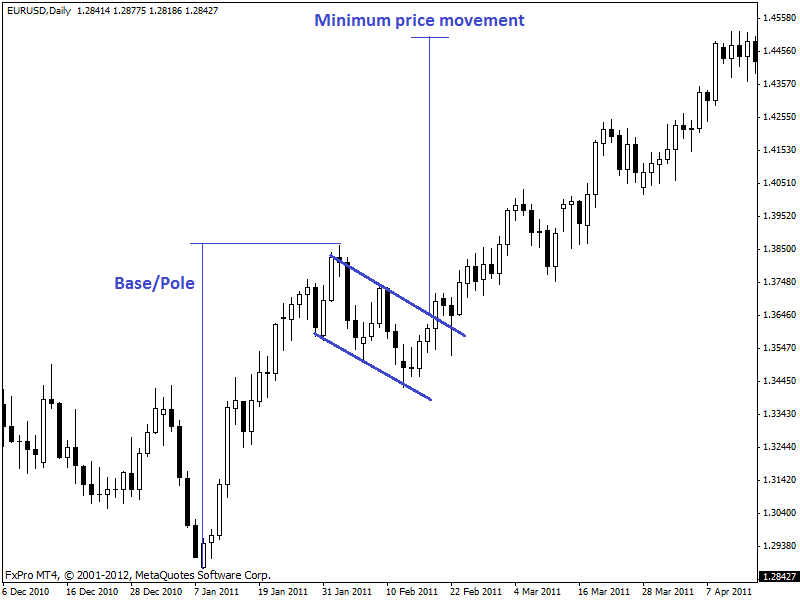
In the chart above, we can see a flag pattern in the chart of daily EUR/USD. After the breakout of flag pattern, the price of EUR/USD moved upward and also touched the minimum possible price movement.
Pennant pattern :
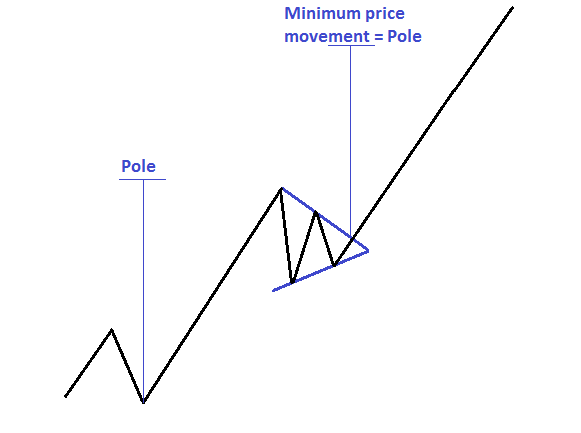
Pennant pattern looks like a symmetrical triangle, but there are some differences between a pennant and symmetrical triangle pattern. Pennant pattern requires less time than a symmetrical triangle. This is one the significant differences.
Pennant pattern develops after a sharp price movement, and it consists two converging trend lines.Here is an example of the structure of pennant pattern.
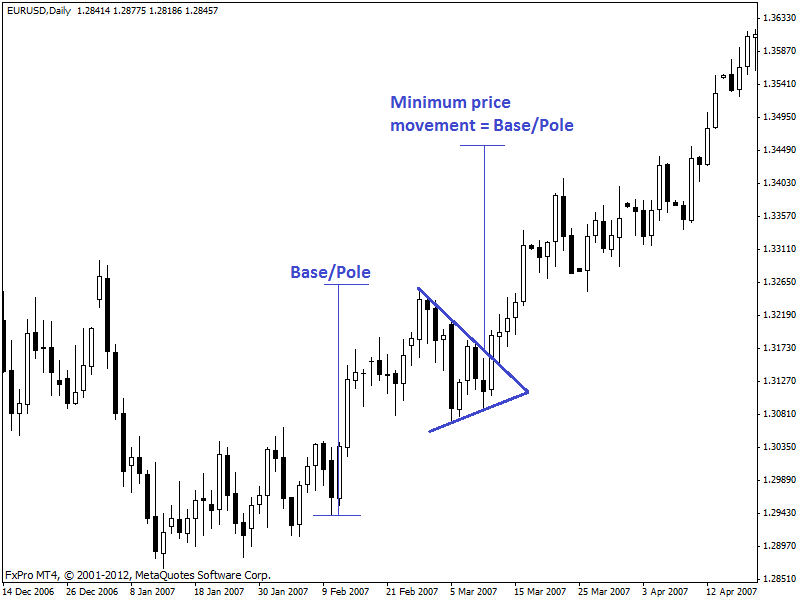
An example of pennant pattern in the daily chart of EUR/USD has shown in the chart below.
