Overview
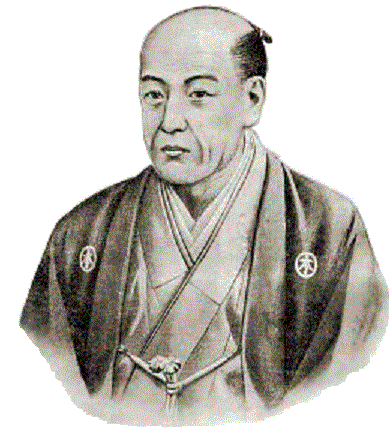
Price action trading in forex might seem like a relatively novel idea, though its roots date as far back as the 1700s. Widely considered the father of candlestick charts, Munehisa Homma was a Japanese rice merchant who died in 1803. He traded the prices in the rice market through many of the candlestick or price action patterns in use today, some of which he named.
Indeed, it’s incredible to think the idea of price action started centuries ago, well before any other technical tools existed. Nowadays, price action has become more than just about interestingly named candlesticks. Price action traders are religious in their belief that trading should be simple and minimalist. Price action is merely analyzing market movements purely using candlestick charts without the use of any indicators.
Price action traders believe how buyers and sellers intimately feel in the markets is always reflected in the price. Each candle that appears tells a story of what bulls and bears did during that time and what they could do next.
The basics of price action
To understand price action is to familiarise yourself with the formation of a candlestick. We visualize price better with Japanese candlestick charts instead of other charts. Candlesticks are more graphically dynamic as they attempt to reflect much more information than other charts would. Of course, they are also aesthetically pleasing to the eye.
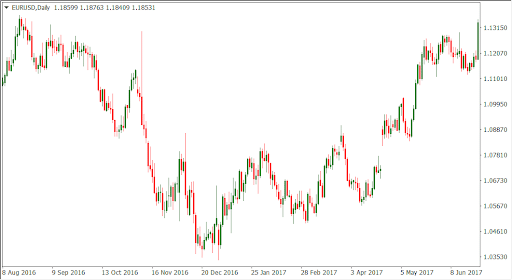
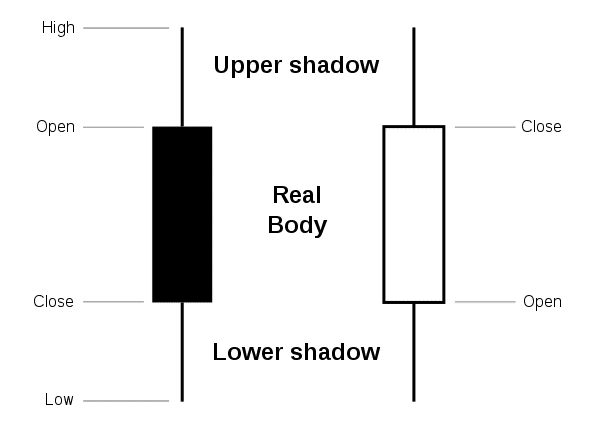
Any candlestick, regardless of the market or time-frame it appears, contains three distinct components that traders analyze: the price, the shadow, and the body. The picture below reflects these components.
The price and shadow
Each candle consists of four bits of information about the price of an instrument within an observed time-frame:
- High
- Low
- Open.
- Close.
Though all this information might appear simplistic, all price action patterns rely on observing any of these aspects of price. It’s up to the trader in deciding which factor of the price is significant to them, but each part holds weight. For example, traders often consider the closing price as the most critical of all, especially on bigger time-frames.
The notion is that the closing price concludes everything a market has done in a particular spell. The closing price would ultimately culminate all this behavior into a verdict over whether the buyers or sellers won the period in question and who may win the next one. Traders also use the closing price for safer entries in trades since, in most cases, markets are usually in a flux of unpredictability during the first three stages of price.
The shadow is merely a representation of how all of these four aspects have occurred. We commonly refer to it as the wick or tail. For example, a candle with a very shallow wick suggests that there was very little difference between the open and low (or high and close). Traders would then observe the body of the candle to make a conclusion.
The body
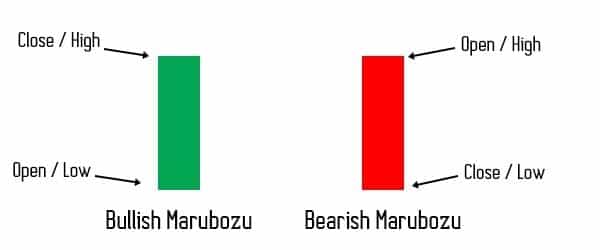
The body reflects the dominant force for a certain period. Generally, a candle with a body that covers much of the entire candle signals strength. The marubozu, for example, is a mostly full-bodied candle with very tiny or usually no wicks whatsoever, which suggests dominance. So, a bullish marubozu is a signal that the buyers dominated whichever period in question and that they may dominate again consequently. When the body is smaller, that could suggest the opposite effect, less dominance.
These three components are what price action enthusiasts observe regarding candles. Patterns are a collection of various candles, which all mean something to what price may move like eventually. We can discern a popular price action pattern such as the pin bar since it’s a powerful and popular candlestick that provides critical information about all aspects of the price.
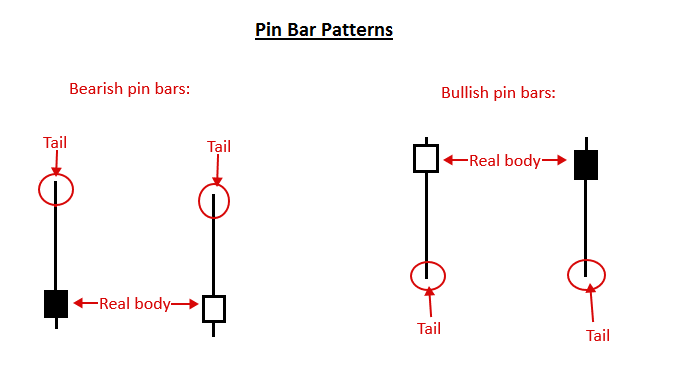
We consider the pin bar as a reversal or trend continuation sign depending on where it forms in the market. The unique features of a pin bar are an extremely long wick that makes up the majority of the candle and a small body. This long wick is considered a rejection of price.
As an example, a bullish pin bar entails that the market initially pushed the price down and then aggressively reversed, causing a trap for traders that believed the price was going lower. Pin bars are ubiquitous in fakeouts as a result. During the formation of a bullish pin bar, the body itself may have been bearish. However, due to the rejection, the body turns to bullish, suggesting that buyers have forcefully come into the market and can potentially push it higher.
The pin bar is just one price action pattern. Many others all tell their unique stories about the price that analysts use to predict where price may head to in the future.
Best way to trade price action
As with any methodology of trading, traders could get bogged down by the number of price action in existence. The first consideration is that it’s best to select one or two strong price action patterns rather than anymore for simplicity reasons.
The second consideration is that a price action pattern on its own is not an objective nor a high-probability approach to trading. Context is what matters in price action trading or any strategy for that matter. By looking at any random chart, patterns continually form, but most of them don’t matter if they don’t appear in significant areas.
This idea is what we mean by context. For example, a pin bar that appears on any time-frame is not necessarily a reliable sign of a reversal. However, one which forms at a key support or resistance level on a large time-frame like the D1 is noteworthy. The context here is the critical support and resistance and the large time-frame. Other traders like to use price action for supply and demand, Fibonacci, pivot points, and a host of other technical tools. So, in essence, a price action pattern in isolation is futile without other confirmation factors.
Conclusion
Every pattern tells one about the four parts of the price (open, close, high, low), the body, and the shadow, which they can interpret in several ways. How we analyze this data has to align with the broader market context and other confirmation biases. The best manner to trade price action is by sticking to one or two patterns, formulating robust rules around them, and using that with other technical and confirmation tools.


