Almost every modern retail forex trader knows about the importance of trading with chart patterns. It is an essential aspect of conducting technical analysis and involves many different chart patterns that help traders read the data.
Traders conduct technical analysis across almost every type of market and on any timeframe. However, they work specifically on freely traded markets. This means that technical analysis may fail to work when regulators intervene such as central banks across countries. Yet even under such circumstances, traders who use charts have an advantage. They can still stick to the patterns and apply money management rules.
There are several types of charts that are used by traders worldwide. However, in this article, we discuss fifteen of the most common types of charts available. These will be categorized according to certain groups as mentioned below.
Triangles
One of the most common types of charts used by retail forex traders is triangles. There are several different variants of triangle charts, as explained in brief below.
1&2. Ascending and Descending triangles
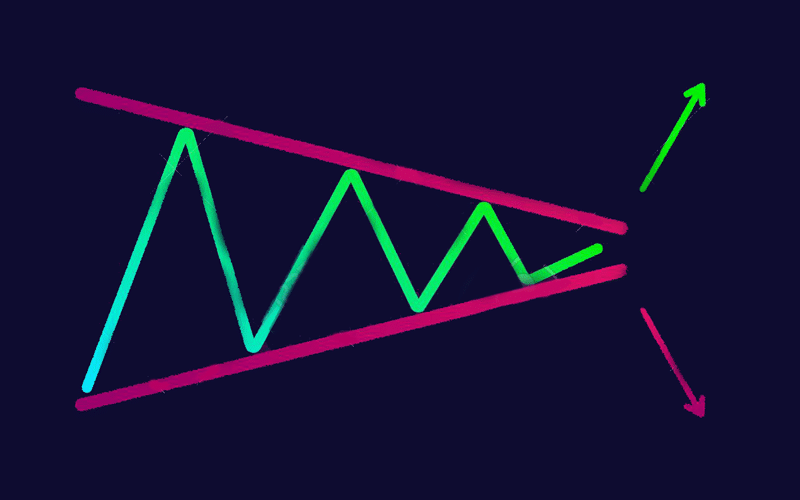
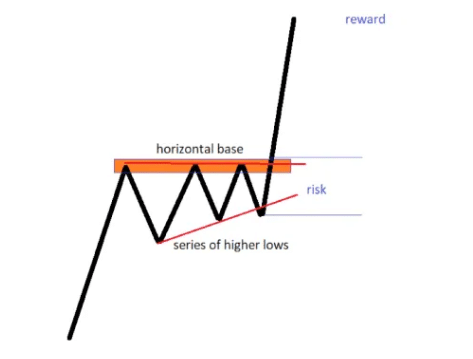
Both Ascending and descending triangles are called so because of their shape and have one thing in common: both of them reveal powerful price action. In this case, the price builds energy to either break higher or lower in case of an ascending or descending triangle respectively. But the price action revolves around the horizontal base which is a key element to these types of triangles.
For an ascending triangle, the dips don’t break the series of higher lows that are formed. On a breakthrough, traders should always go along with a stop-loss at the last higher low. The target should be three times the initial risk taken. The opposite is true for the Descending triangle.
3. Limiting Triangles
Limiting triangles, as the name suggest, works for limiting the resulting price action. During the formation of such triangles, no part of the price action pierces either of the two trendlines, all the way until the breakout. When using limiting triangles, traders have to be aware of when the price breaks the triangle and there is no retesting. The price continues in the primary trend’s direction, making a new high. The price finally reverses to the apex of the limiting triangle.
4. Non Limiting Triangles
In non-limiting triangles, no barriers exist against future price action. Even though they continue the existing trend and typically appear as reversal patterns. There are 2 striking differences between limiting and non-limiting triangles. Firstly, non-limiting triangles almost always retest the broken trend-line. Secondly, In the case of non-limiting triangles, the apex plays no role in providing support and resistance for future price action. It should also be noted that non-limiting triangles do not have any measured move.
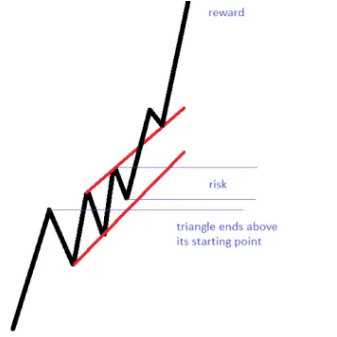
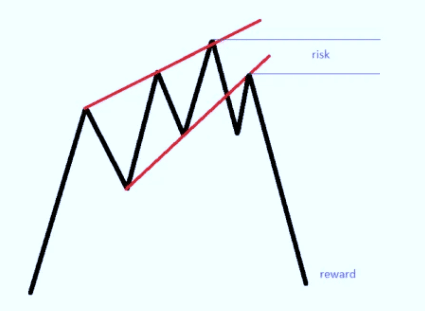
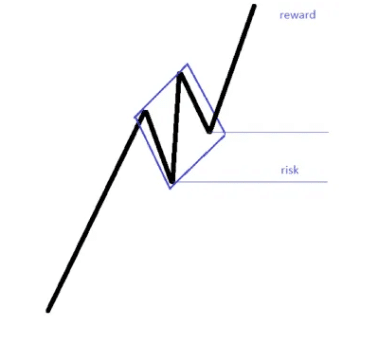
5. Running Triangle
The concept of a running triangle is one of the most common yet controversial charts used in forex. A running triangle ends above its starting point in a bullish trend. Traders usually use a risk reward of 1:5 or even more, when trading with running triangles.
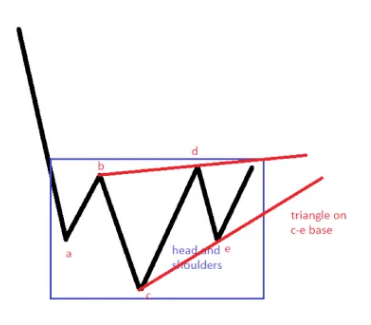
6. Special Types of Triangles
There are certain types of triangles that resemble a “head and shoulders” pattern which will be discussed later. It forms at the end of trends, forms at tops and bottoms and is a powerful pattern. However, very few consider it being a triangle that reverses a trend.
Wedges
Wedges are another form of popular forex chart patterns and are divided into two types: rising and falling. Falling wedges have a bullish characteristic as the price explodes higher after the resistance is broken on the upper trend-line. Similarly, rising wedges possess a bearish characteristic and the price is bound to fall by the time it breaks into lower trend-line.
7 &8. Rising and Falling Wedges
Risings and falling wedges are usually considered by traders to be reversal patterns. When trading with these chart patterns, traders have to consider the following:
- The Final leg of the wedge pushes against the trendline. If this doesn’t happen, traders can ignore the pattern.
- They should wait for a retest of the lower or upper trendlines in the case of rising and falling wedges respectively. This can be a great entry place for a trade.
- Traders should always have a stop-loss above the lowest or highest point in the wedge. The “rr” ratio should be a minimum of 1:3
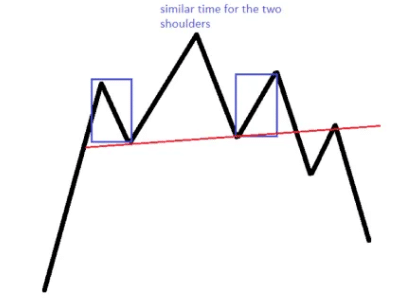
9. Head and Shoulders
As mentioned before, head and shoulders patterns reverse trends. When trading with head and shoulders patterns, the time element plays a crucial role. Traders should look out for the time it takes for the left and right shoulders to consolidate to be similar. The pattern becomes more powerful when both the left and right shoulders are the same.
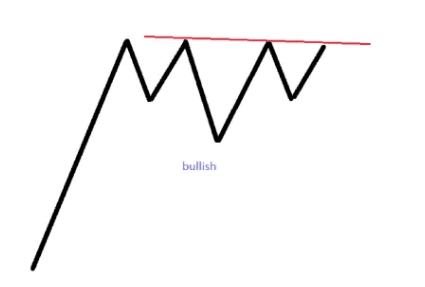
10. Head and Shoulders as Continuation patterns
Despite the fact that head and shoulders patterns are normally reversal patterns, they sometimes form in an unusual place. It is considered to give a bullish sign when the inverted head and shoulders pattern appears on the top of the bullish trend.
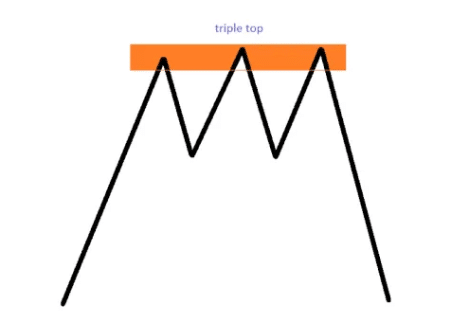
11. Triple Tops and Bottoms
Triple Tops and Bottoms are more reliable than double tops and bottoms which are used by many traders the world over. A Triple top requires a horizontal base which is considered as an area and not a level. They are reliable charts but tend not appear that often. Triple Tops and Bottoms often turn into continuation patterns.
12. Diamond Formations
Diamond formations show continuation and are characterised by being almost vertical and a spike higher in a bullish pattern. The price drifts lower afterwards, until reaching the edge of the diamond, where the real break comes in.
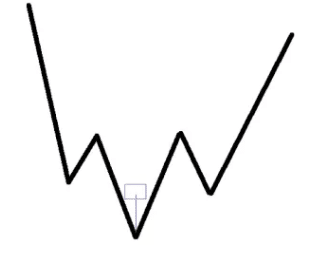
13. The hammer
The hammer is a type of single candlestick pattern where a pin bar appears at the bottoms of the chart. The chart reinforces its reversing power, when forming at the lowest point of an inverted head and shoulders pattern.
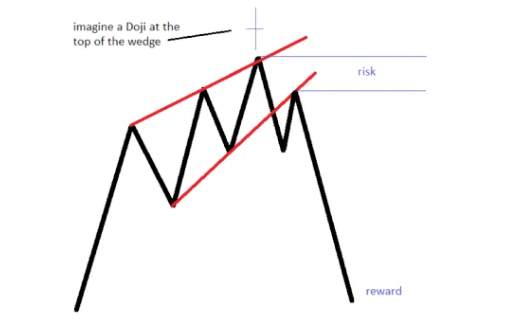
14. Doji Candlestick
The Doji candlestick is another single sided candle stick chart pattern with little or no real body. It signals that the end of a trend is imminent and is considered also as a reversal pattern. A Doji at the top of a rising wedge can reinforce its bearish bias.
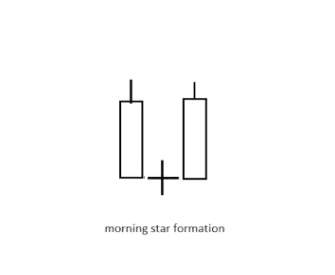
15. Morning and Evening Stars
Morning and evening stars are a three-candlestick pattern. Their power increases exponentially when traders combine it with classic technical analysis patterns.
Conclusion
The above are just some of the patterns used by traders in the forex market. It should be known that while using any chart patterns in forex, using proper risk reward ratios are mandatory.


