The trend is your friend is a famous analogy that traders are constantly brainwashed with. A small portion of strategies focuses on reverse setups in the trading world, while most include following the masses. Over time software developers have made various EAs and indicators that work with the market’s overall direction or provide information on where the price is going. Our article will discuss what trend trading means and highlight a few drawbacks of this system.
An overview of the trend
In technical analysis, a trend forms when the market consistently makes higher highs and lows or lower highs and lows in the same direction. It rhymes with the concept of Elliot wave analysis and Fibonacci intervals.
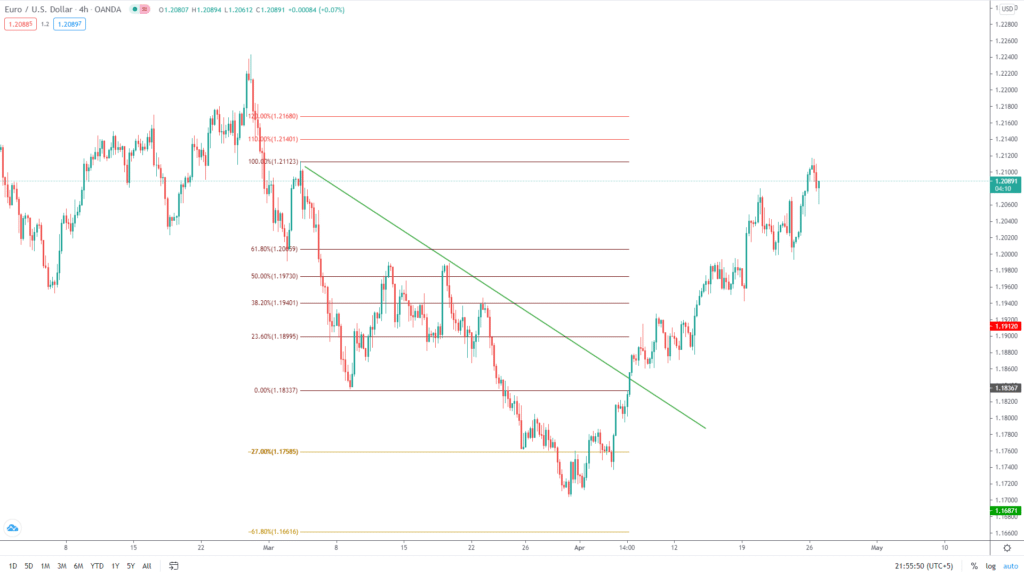
Image 1. A trader plots Fibonacci to point out significant retracements. The overall trend in this chart for a short interval is on the downside. Trendlines help our cause.
For an instrument to flow perfectly in one direction, it must not cross 100% retracement on the Fibs. Any activity of such sort will lead to the break of structure and point to the reversal in the trend direction.
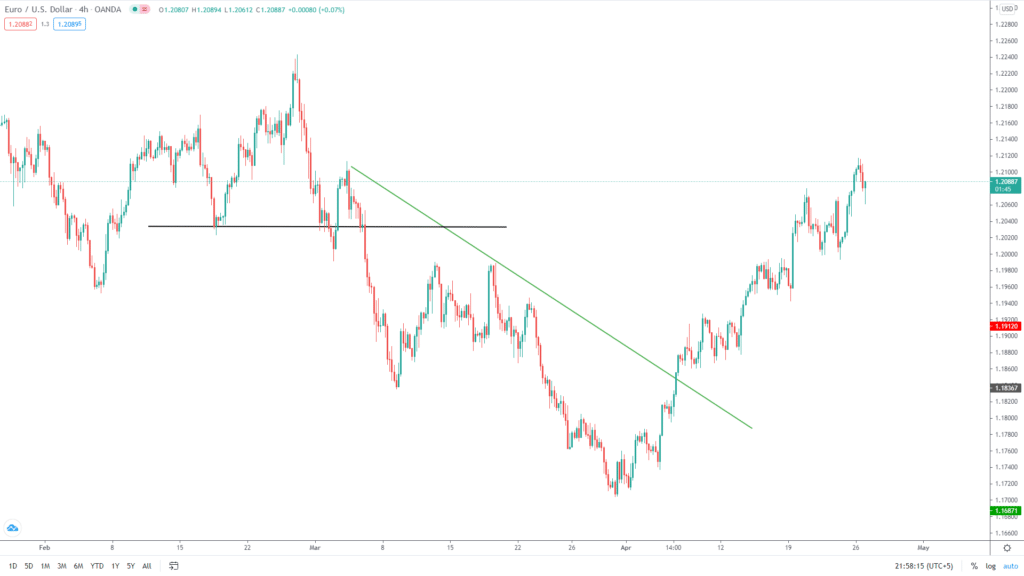
Image 2. In our previous example, we were able to identify the downtrend by looking at the breaking point of the structure. As soon as the price crosses the black line, we look for short trades in case of trend trading.
Trend based strategies and their advantages
Game plans based on trends provide a good risk to reward ratio and winning percentage.
Buying the dips
A notorious strategy involves placing buy orders on the respective retracement on the Fib levels. For further confirmation, traders also use candlestick patterns. The stop loss lies beneath the 100% or 0% Fibonacci. The most common points of retracements are 38.2%, 61.8 and 88%. 50% does not provide sufficient proof on either side as the market can go both ways.
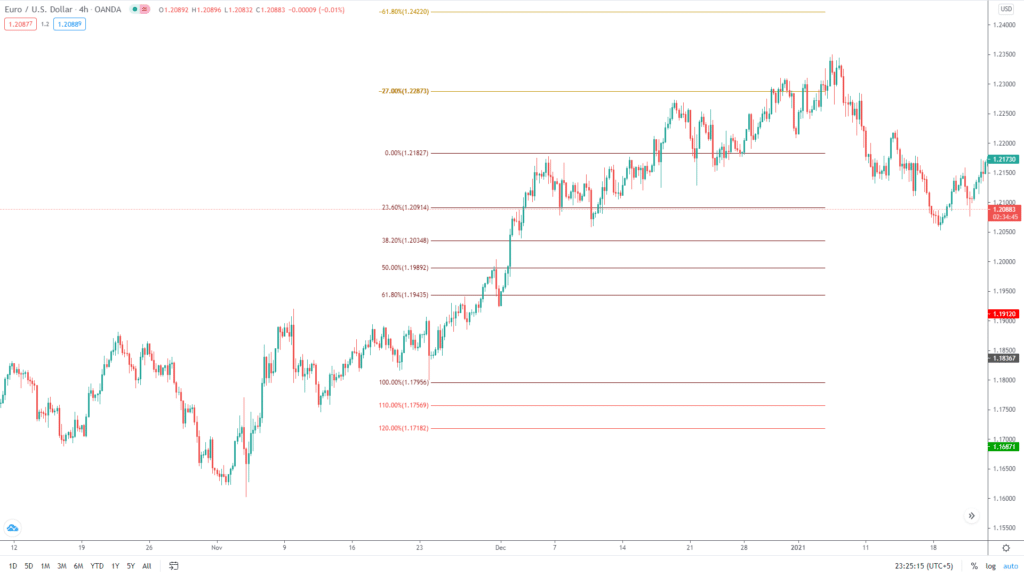
Image 3. For a current uptrend, the Fibs can be drawn from bottom to top. Customize the retracement values according to your liking.
Using indicators
Indicators such as moving averages, Ichimoku cloud, MACD, etc., can provide good information about the current trend and its strength. MAs that point in an upward direction relate to an uptrend and vice versa. Using multiple indicators to provide confirmation, a trader can get a good trading setup with ease.
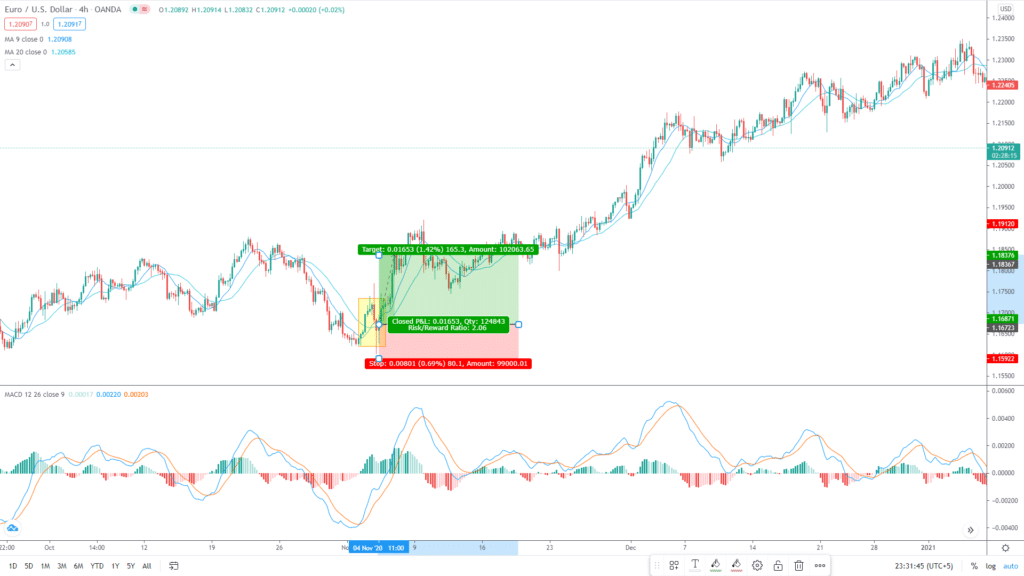
Image 3. The moving average crossover indicates a shift in the current trend where the MACD prints green bars showing strong bullish momentum. Trading alongside the current trend, we have an opportunity with a good risk/reward of 1:2.
Reversal points
It is also possible to predict the points where the market will likely take in reverse gear. We utilize Fibonacci intervals here again and use corresponding levels of -27% and -61.8%. This we can catch both sides of the trend, making easy pips.
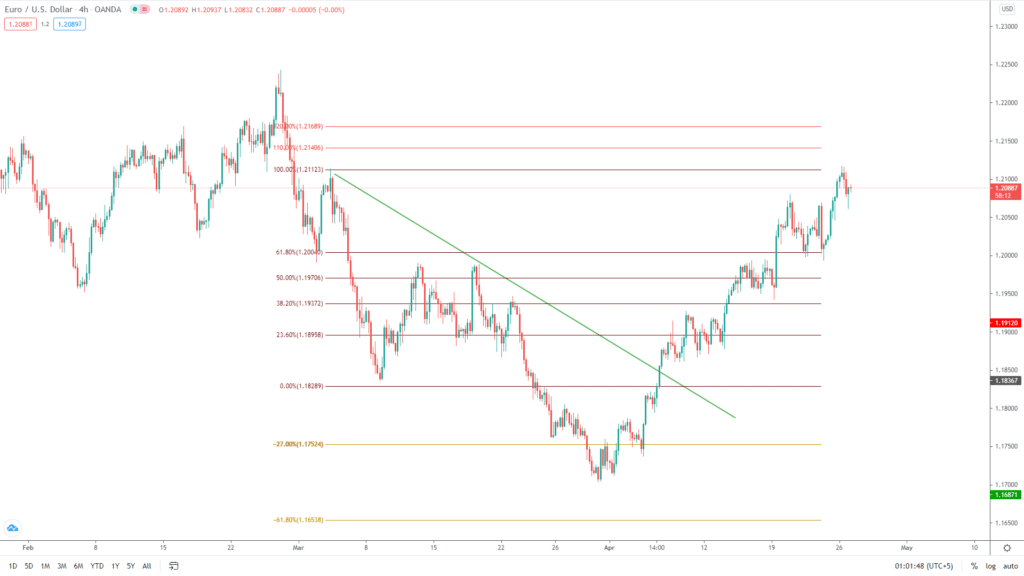
Image 4. Using the previous chart, we plot the Fibs for our downtrend. The respective levels are available on the price action.
Broad application
Trends are the byproduct of fear and greed, which pushes the market in their respective direction for a long duration. The short-term reversals are due to the profit taking by banks or investors. As the buying or selling is at par with all instruments, trend trading takes on broad application. Treasury bonds, indices, futures, forex, stocks, etc., all follow the same path.
Time frames
Traders can observe trends on different time frames, including weekly, daily, H4, M15, and M5. As there are several modifications solely based on periods, trends help in applying various trading styles such as scalping, day, and swing trading. However, keep in mind that price movements on bigger charts will always prevail in terms of trend.
Exact timing
While trading with the trend, even if you are wrong in your analysis and making a lousy entry, your execution’s overall outcome will still be positive. The market will soon move into your favor and result in a breakeven at a worst-case scenario.
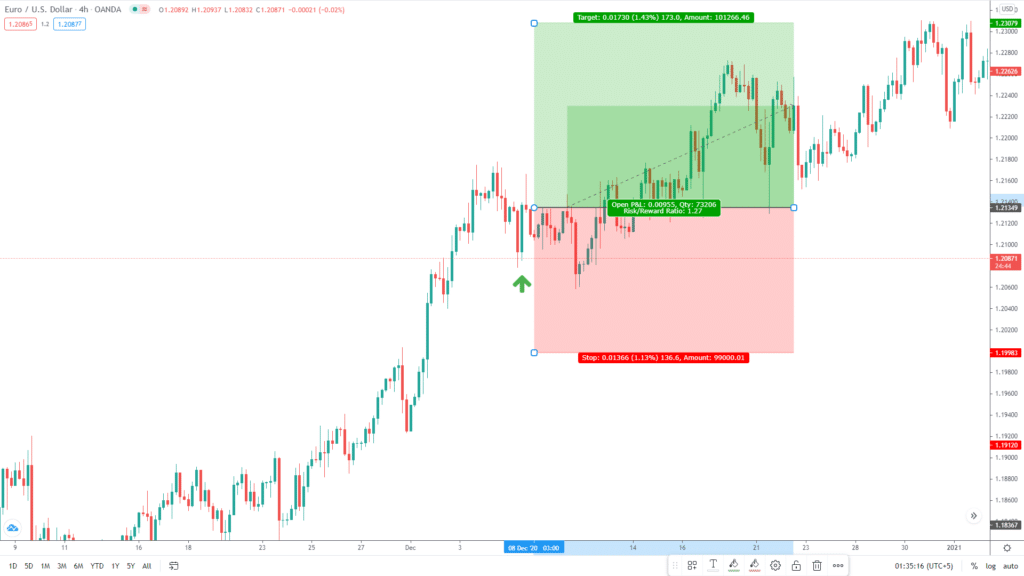
Image 5. Even if a trader gets a slightly wrong entry and experiences a little drawdown, the market ultimately turns in his favor. Some participants may take more entries as the price moves against them. This form of trading is called market making and is popular amongst hedge funds and institutions.
A few demerits
We can observe the following disadvantages while following trend trading:
- Fake outs. The chances that a trader will be stuck identifying major trends is high as the markets are consolidating for a significant duration. Breakouts from the support and resistance can lead to fakeouts as the price is determined to stay within the range.
- Lagging. For some market participants, trend trading might be lagging. A moving average is one of the lagging indicators. MA crossover strategy is not good enough for catching the complete move in its initial stages.
- Riding trends are hard. Riding a complete wave with its ups and down demands a ton of psychological effort from the trader. The investor must show a proper mindset and ability to get out of the position at the exact ending point of the trend.
End of the line
Trend trading indeed comes with a lot of benefits for traders. However, alongside any strategy, a trader must represent sound risk management and emotions to implement it properly. Beginners who are stuck with consistency should try and include this form of trading. It can improve your output by a good margin.


