Chart patterns are at the heart of any serious and successful technical analysis of securities in the capital markets. The price fluctuates whenever the market is open, resulting in the creation of detailed chart patterns. Technical analysts analyze these patterns manually or with the help of forex expert advisors to detect trading opportunities. Each pattern created allows technical analysts to make informed decisions on matters at entry and exit points in the markets.
Technical analysts study chart patterns when engaging in scalping, trend trading, or position trading. Similarly, FX expert advisors rely on chart patterns to generate trading signals in addition to ascertaining profitable trading opportunities.
In the financial markets, chart patterns represent price hesitation as price tends to move within a specific range until a breakout happens. Similarly, forex robots study these patterns to generate trading signals in case of an imminent breakout.
The three main chart patterns that technical analysts study to ascertain trading opportunities are
- Neutral Patterns
- Continuation Patterns
- Reversal Chart Patterns
Continuation Chart Patterns
Continuation chart patterns are ideal chart patterns for trend trading. The patterns indicate a pause in the underlying long term uptrend. Likewise, the likelihood of price resuming the uptrend is usually high once in case of a breakout from the consolidation phase.
A perfect example of a continuation chart pattern is the bullish flag pattern. The pattern occurs when the price is trending upward and then pulls lower, resulting in the creation of a channel whereby price tends to oscillate in a flag.
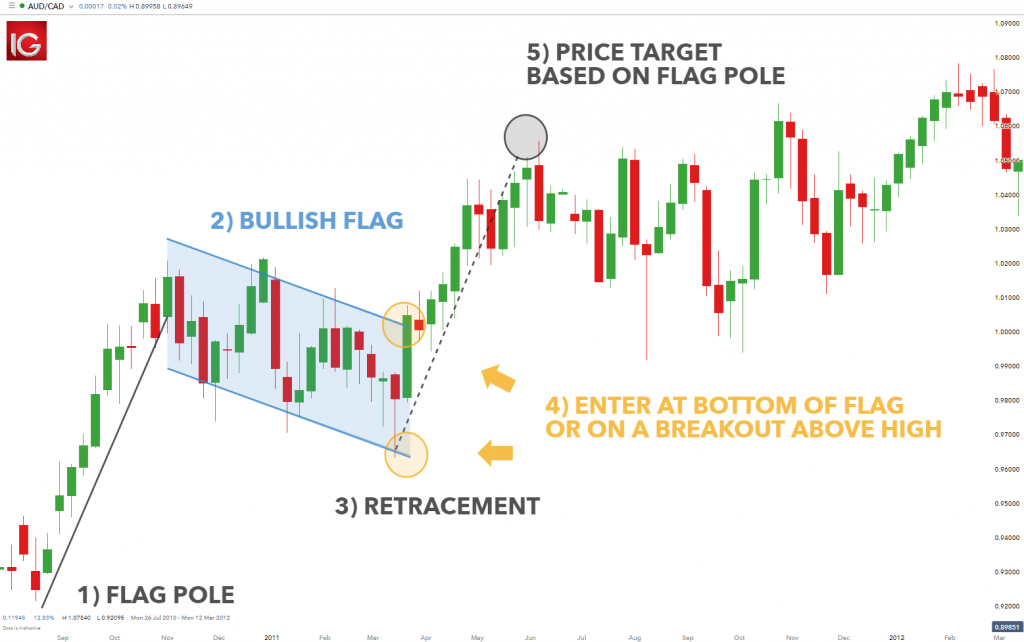
The bullish flag pattern occurs whenever traders take profits resulting in a pullback that results in price oscillation between higher lows and lower lows. After some time, the price tends to break out of the flag and continues in the direction of the uptrend. Bullish falling wedge, Bullish Pennant Pattern is other continuation chart patterns that indicate long term uptrend will resume after some time.
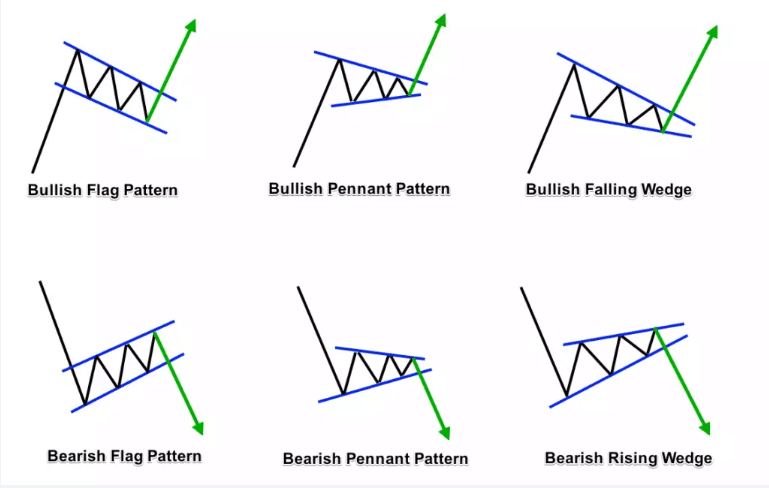
Similarly, Bearish flag pattern Bearish Pennant Pattern and Bearish Wedge is essential forex charting tools that indicate an underlying bearish trend is likely to resume.
Continuation chart patterns are thus important for forex trading secrets for traders looking to benefit from trend trading.
Reversal Chart Patterns
A reversal chart pattern is critical money-making hacks for traders looking to profit from trend reversals in the market. Acting as the opposite of continuation chart patterns, reversal chart patterns signal that the current trend is likely to reverse, causing a fresh move in the opposite direction.
Forex EA leverages reversal chart patterns to generate trading signals indicating a potential change in the direction of the underlying trend. Some of the most popular forex charting tools for signaling a potential trend reversal are double tops or double bottoms as well as head and shoulders, wedges and expanding triangles
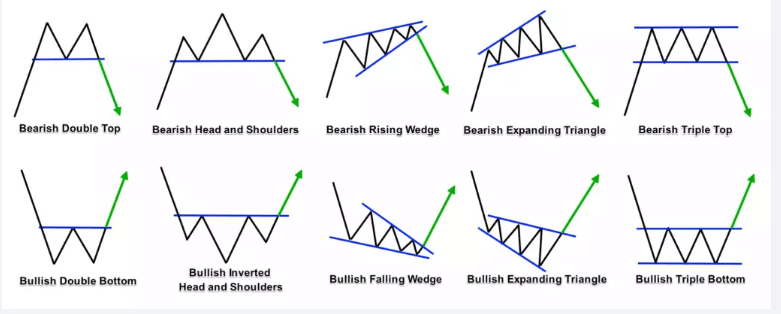
The bearish double top is a common reversal chart pattern that signals the underlying uptrend has lost its strength. Whenever this chart pattern occurs, price tends to reverse from an uptrend, consequently starting to edge lower in a downtrend.
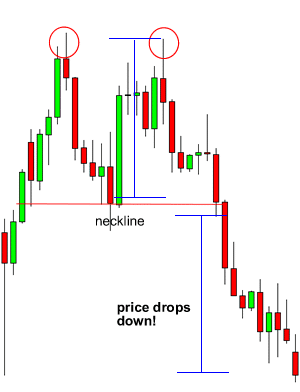
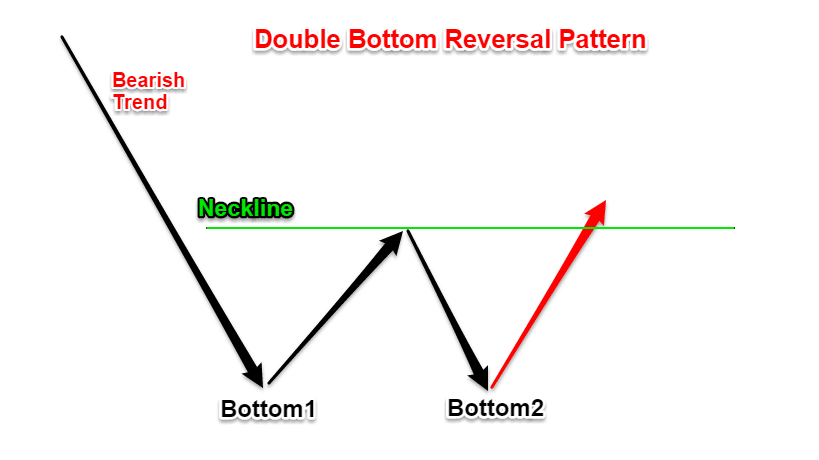
Bullish double bottom is the opposite of the bearish double top that signals a downtrend has lost its edge or strength. In most cases, price reverses and starts to move upwards.
Bearish head and shoulders, bearish rising Wedge Bearish Expanding Triangle and bearish triple top, are common reversal chart patterns that signal price is about to reverse from an uptrend to a downtrend
Bullish inverted head and shoulders, bullish falling wedge, Bullish Expanding Triangle, and bullish triple bottom on the other hand signal a downtrend that has lost its momentum, and that price is about to reverse and start moving upwards.
Reversal chart patterns are ideal forex chart tools for traders looking to benefit from trend reversals while scalping position trading or news trading.
Neutral Chart Patterns
Neutral chart patterns are patterns that don’t deduce which direction price is likely to move after consolidation. The fact that direction is unknown makes it extremely difficult to predict whether the price is expected to move up or down.

Whenever neutral chart patterns occur in a chart, it is crucial to wait and see in which direction the pattern will break before opening a position. Ascending Triangle, Descending Triangle, Symmetrical Triangle, and symmetrical expansion are the most popular neutral chart patterns.
Bottom Line
Chart patterns indicate price hesitation signaling a period of consolidation within a given range. Once the consolidation is over, price tends to break out, in the direction of the underlying trend or reverse, and start moving in the opposite direction.
Mastering, flag, pennant, and wedges as part of continuation chart patterns as well as reversal chart patterns in the form of double tops & bottoms as well as expanding triangles and wedges is important for any trader looking to benefit from technical analysis. Similarly, it is important to note that FX EA studies these charts as part of automated trading to generate trading signals.


