Relative Strength Index (RSI) and Commodity Chanel Index (CCI) are some of the best forex indicators for automated trading as well as manual trading. Technical analysts, as well as forex robots, use the two indicators to ascertain market momentum as well as identify ideal entry and exit points. While the two forex charting tools can be used on their own in analyzing chart patterns, they are often used in combination for the best outcomes.
Understanding RSI Indicator
The RSI indicator is simply an oscillator that oscillates between two extremes of 0 and 100. The indicator stands out as one of the best forex trading instruments on the fact that it provides information on overbought and oversold market conditions.
Conversely, whenever the RSI reading is above 70, the same is interpreted as overbought market condition. In this case, forex robots or traders refrain from taking long positions as the likelihood of price reversal is usually high.
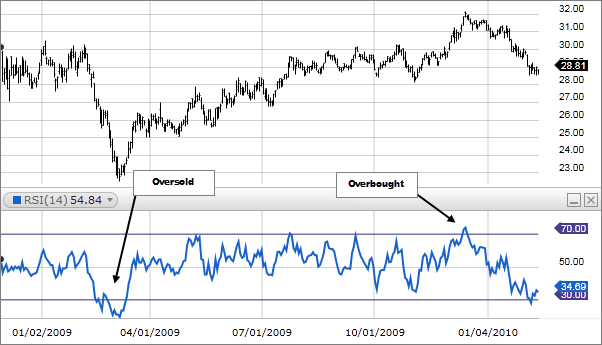
Similarly, whenever the RSI reading is below 30, the same is interpreted as an oversold market condition. In this case, the likelihood of price reversing and starting to move higher is usually high as the underlying asset is usually considered cheap.
Understanding CCI Indicator
The Commodity Channel Index is an important forex charting tool that measures the current price of a security, understudy, relative to its average price level over a given period. The indicator’s reading tends to be relatively high whenever the prevailing price of a security is far above the average. Similarly, the reading tends to be low whenever the price is far below the average.
Just like the RSI indicator, the CCI indicator can be used to ascertain overbought and oversold market conditions on given security under study. Whenever the CCI indicator reading is above +100, the same implies a strong uptrend is beginning, signaling overbought conditions. In this case, traders should be wary of entering a long position as price tends to have a tendency of reversing.
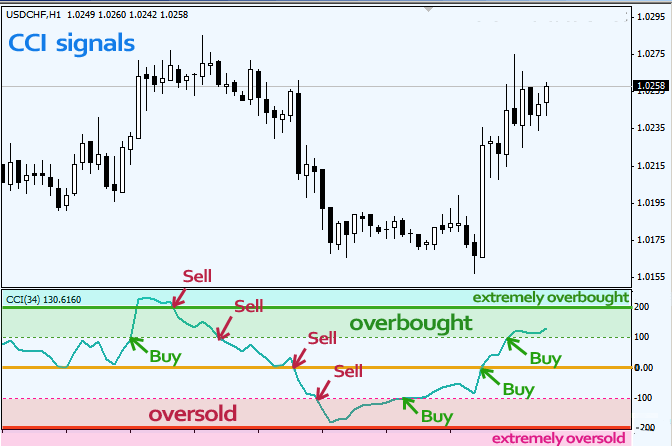
Similarly, whenever the CCI reading is below -100, the same implies a strong downtrend. In this case, FX Expert advisers or manual traders enter long positions to take advantage of potential price reversal as a security is considered to be oversold.
RSI and CCI Combination Trading Strategy
RSI and CCI indicators are commonly used in scalping as well as trend trading and news trading, given their ability to identify oversold and overbought market conditions. Similarly, when used together, be it in automated trading, algorithmic FX trading or manual trading, the indicators help shed more light on ideal price targets for opening and closing trades.
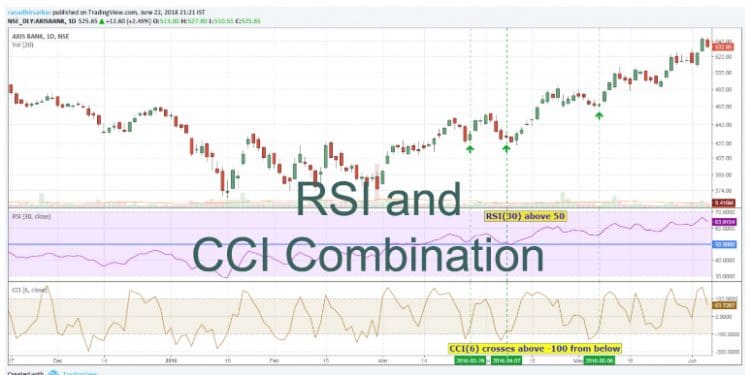
To use the two indicators, firstly, tweak the RSI parameters to a 30 period RSI in place of the default 14 periods. The change in settings helps insulate against short term price fluctuations that can be misleading. Similarly, add a 50 line on the RSI indicator in addition to the default 70 and 30 trend lines that indicate overbought and oversold conditions.
When it comes to the CCI indicator, it would be wise to stick to the 20 period CCI as it tends to be more immune to short term price changes that can be misleading. The overbought and oversold limits at +100 and -100 should remain the same.
Buy Set up While Using RSI and CCI indicators
A trader should only consider entering a long position or buy when the RSI reading is above 50. Such a reading indicates an underlying upward momentum in the price of the underlying security. In this case, traders should only consider long positions.
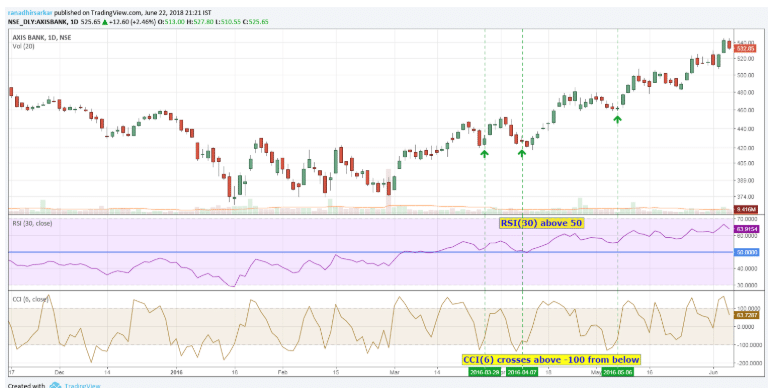
The CCI indicator will, in this case, help in generating signals for opening long positions. For a buy, signal turn to a 6 period CCI and look for when the indicator crosses -100 from below. Whenever this happens, then it would be wise to enter long positions.
A stop-loss can be placed a few pips below the entry point. Similarly, a trader should be ready to take profits when the 30 period RSI crosses below the 50 lines from above.
Sell Set up Using RSI and CCI indicator
The RSI strategy can also be used to open short positions while relying on the CCI indicator for a signal. Conversely, whenever the RSI indicator is below the 50 line the same indicates the underlying price has turned bearish, and that price is likely to continue edging lower.
In this case, traders should only consider short positions. A signal to enter short positions will happen when the 6-period CCI indicator crosses the +100 mark from above. Profits should be taken when the 30 period RSI crosses above the 50 line indicating a trend reversal from bearish to bullish.
Final Thoughts
RSI and CCI are some of the best forex trading instruments given their ability to shed light on overbought and oversold conditions. When used together, the indicators can aid in ascertaining ideal entry and exit points perfect for mitigating losses and optimizing profits.


