ForexEzy
No Result
View All Result
  • Home
  • Getting Started with Forex
  • Forex Education
    • Forex Basics
    • Forex Trading Strategies
    • Money Management
    • Risk Management
    • Technical Analysis
    • Fundamental Analysis
    • Trading Psychology
    • Social Trading
    • Automated Trading
  • Forex Tools
    • Forex Robots
    • Forex Indicators
    • Forex Signals
  • Top Forex Brokers
  • Top Forex Robots
  • Commentary
  • Blog
No Result
View All Result
ForexEzy
No Result
View All Result
Home Forex Education Technical Analysis

Commodity Channel Index (CCI) – A Popular Oscillator

by Tim Baudin
September 8, 2016
in Technical Analysis
0
Commodity Channel Index (CCI) – A Popular Oscillator
0
SHARES
11
VIEWS
Share on FacebookShare on Twitter

Commodity channel index (CCI) is a popular oscillator which was developed by Donald Lambert. He described this oscillator in Commodities magazine in 1980.

Donald Lambert developed this indicator to identify cyclic turns of commodities, but this indicator has shown its effectiveness in currencies, stocks, indices, ETFs and other financial instruments.

Calculation:

The basic period for this indicator is 20. For 20 days CCI, the calculation is as follows.

CCI = (Typical Price – 20 period SMA of Typical Price) / (0.015 x Mean Deviation)

Here, Typical price = (High+ Low+ Close) / 3

0.015 is a constant in this calculation.

Interpretation:

Commodity Channel Index (CCI) is a leading indicator that can be used in various ways. Such as,

Trend Identification:

This indicator has the capability to measure the trend direction. Trend direction is identified as CCI surges above +100 and plunges below -100. The prevailing trend is considered as uptrend when CCI line is above +100. On the other hand, the prevailing trend is considered as downtrend when CCI is below -100.

Here is an example chart showing uptrend given below.

Commodity Channel Index (CCI)

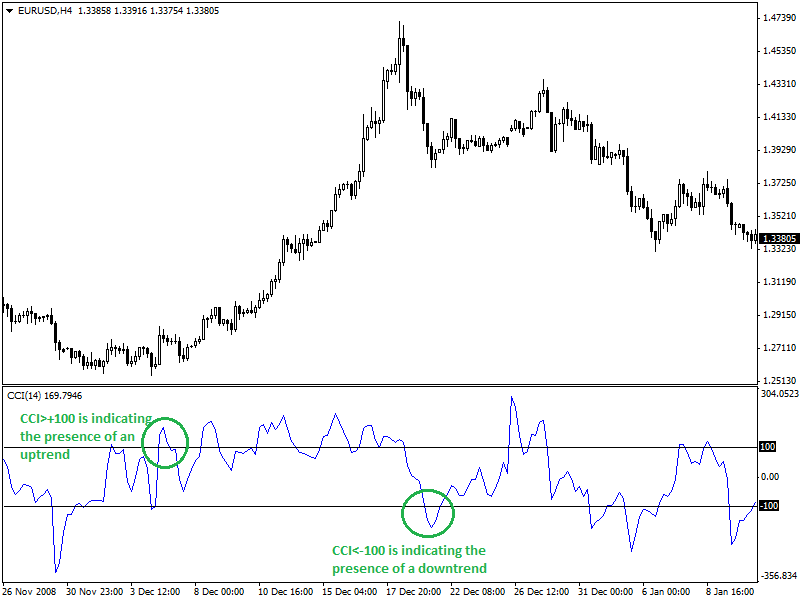
4-hour chart of EUR/USD is showing both uptrend and downtrend identified by using CCI indicator. Traders look for buy signal or entry signal for the long position as CCI moves above +100. Traders look for sell signal or entry signal for the short position as CCI moves below -100.

Overbought and Oversold:

Overbought and oversold level are complex to identify and trade as there is no range for this indicator and price can continue moving in the previous direction after reaching overbought or oversold region. Some traders use +100 and -100 levels as overbought and oversold level respectively. But +200 and -200 levels are more extreme and work better to determine oversold/overbought region.

It is considered that the price will get support and become bullish as soon as CCI reaches below +200. This is a psychological level that indicates that demand might increase after heavy selling. It is considered that the price will get resistance and become bearish as soon as CCI indicator moves above +200. This is another psychological level where supply arises due to heavy buying pressure.

Here is an example chart showing oversold, overbought, buy and sell signals. Here is an example is given in the chart below.

Overbought-and-Oversold-Levels-CCI

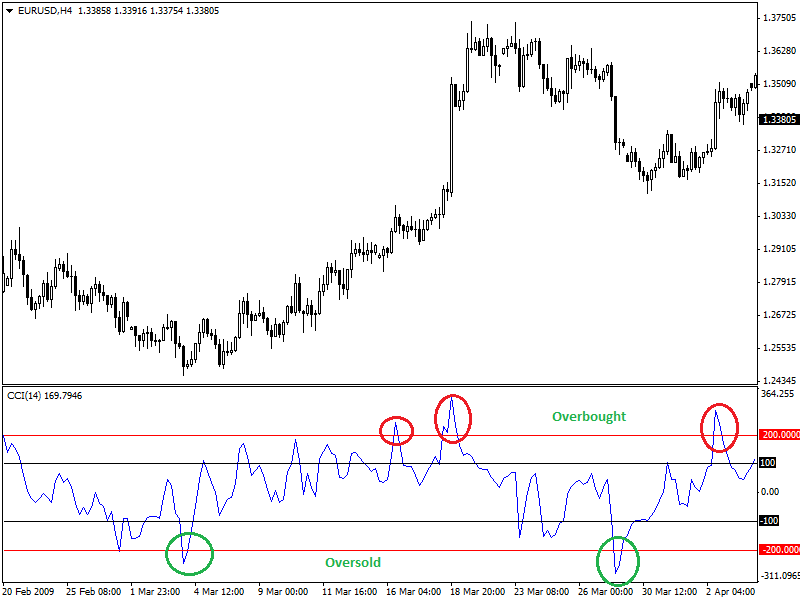
4-hour chart of EUR/USD is showing overbought and oversold levels with buy and sell signals.

Summary:

This indicator works better if combined with other indicators. Different traders use different periods while using CCI indicator. However, lagging indicators like moving average can be combined with this indicator to develop a better trading strategy.

ShareTweet
Previous Post

Williams %R Indicator – (Ranging Indicators / Oscillators)

Next Post

Parabolic SAR Indicator – Trend Indicator

Related Posts

An Introduction To Forex Indicators

An Introduction To Forex Indicators

by Chintan Patel
January 1, 2021
0

What are the Forex indicators? A vast part of technical analysis is understanding and trading with these tools. Although they...

Using Trendlines and Saucer Formations in Trading

Using Trendlines and Saucer Formations in Trading

by Tim Baudin
December 21, 2020
0

Trendlines are those lines that you can recognize easily. A trader draws trendlines on charts in order to connect a...

RSI - Top 3 Real Charts You've Missed

RSI – Top 3 Real Charts You’ve Missed

by Tim Baudin
December 17, 2020
0

Overview Are you still doubting the power of the RSI? This article will cover three recent forex trading opportunities mostly...

The Trading Indicator You Have not Heard of – The Williams %R

The Trading Indicator You Have not Heard of – The Williams %R

by Adam Stanley
December 1, 2020
0

The Williams Percentage Range is a highly effective tool that measures price variations over a period of time for various...

How to Use Technical Analysis in the Market?

How To Use Technical Analysis In The Market?

by Adam Stanley
November 25, 2020
0

If you are trading in the market, you’ll know that uncertainty and risk lurk at every step. In such a...

Load More

Best Forex EA

  • ROFX 9/10
  • Forex Fury 8/10
  • FXgoodway 7.5/10
  • Z Trader FX EA 7/10
  • Forex Incontrol Reborn 6.5/10

Popular News

  • The Best RSI and CCI Combination Trading Strategy for Optimum Returns

    The Best RSI and CCI Combination Trading Strategy for Optimum Returns

    2 shares
    Share 2 Tweet 0
  • Rofx Review – High Profitability and Stable Performance Analysis

    29 shares
    Share 29 Tweet 0
  • The Best Forex Scalping Strategy – Using 3 Popular Technical Indicators

    0 shares
    Share 0 Tweet 0
  • The Best MT4 Indicators & Expert Advisors For Forex Trading

    2 shares
    Share 2 Tweet 0
  • How to check if the indicator is repainting?

    2 shares
    Share 2 Tweet 0

Trading

Footer

We are dedicated to demystify the world of forex trading for you – no matter what level you are on.

Categories
  • Automated Trading
  • Day Trading
  • Forex Basics
  • Forex Brokers
  • Forex Education
  • Forex Forecasts
  • Forex Indicators
  • Forex Market Commentary
  • Forex Robots
  • Forex Signals
  • Forex Tools
  • Forex Trading Strategies
  • Fundamental Analysis
  • Money Management
  • News
  • Risk Management
  • Social Trading
  • Technical Analysis
  • Top World Traders
  • Trading Psychology
  • Uncategorized
Tags
arbitrage atr bollinger bands cci chart patterns classics copy trading courses day trading forex brokers forex charts forex ea forex education forex forecasting Forex Indicators forex software reviews grid trading hedging ichimoku macd market cycles news trading oscillators price action trading rsi social trading strategies tips & tricks trading bots trading platforms trend trading Video
  • Terms of Use
  • Privacy Policy
  • Compensation Disclosure
  • Risk Disclosure
  • About Us
  • Contact Us

Copyright © 2020 by ForexEzy.com

No Result
View All Result
  • Home
  • Getting Started with Forex
  • Forex Education
    • Forex Basics
    • Forex Trading Strategies
    • Money Management
    • Risk Management
    • Technical Analysis
    • Fundamental Analysis
    • Trading Psychology
    • Social Trading
    • Automated Trading
  • Forex Tools
    • Forex Robots
    • Forex Indicators
    • Forex Signals
  • Top Forex Brokers
  • Top Forex Robots
  • Commentary
  • Blog

© 2020, Forexezy.