Trading with this indicator is quite common. In fact, it is the most popular indicator for professionals and beginners. For this reason, I think it is important to clarify some things to see the big picture. According to my trading experience, I have taken the liberty of calling it the five golden rules of moving averages.
- They are the best trend indicator out there.
- There is no universal Moving Average. It can be of different types and periods. In fact, it is best to adapt the indicator to each market and asset.
- MA tends to work much better in the long term than in the short term, as, in most strategies and systems, they work best in large time frames (4 hours, daily, and weekly).
- Trading only with this indicator is usually not a good idea. Experts recommend combining it with some other.
- Buying and selling strategy with crossing moving averages does not usually work because it is a past time indicator, and signals are interpreted with delay.
Now that you know some general information, we will advance more in-depth about this topic.
What type of moving average should we choose?
I know that you were going to ask this. Does it matter if it is 20 periods, 50 or 67? You may be surprised, but the answer is – no, it doesn’t matter at all. Choose the one that best fits the chart and shows well what you personally want to see.
It doesn’t hurt to know that a simple moving average is lazier than an exponential or that a weighted average may be better at sticking to price in hot spots than other types.
We could even talk about how exactly each of them is calculated, but I think it’s totally unnecessary. The only thing that matters in adjusting the indicator is that you like how it looks on your particular chart.
There is only one parameter to touch: the number of calculation periods. The higher this number is, the slower and more clumsy, but also more stable than MA. In resume, play with the number of periods until it fits the way you want.
Examples of well-calibrated and poorly calibrated moving Averages
We already know that MAs are subjective and that one can do a little better than the other. Anyway, when it’s wrong, it’s wrong. Let’s avoid it. We use stocks in our examples today, but the indicator works in a similar way with the currency pairs.
- The first example, poorly calibrated: as it does not show the background trend or the consensus of the value. It is so fast that we can see everything it is trying to tell us by looking directly at the candles.
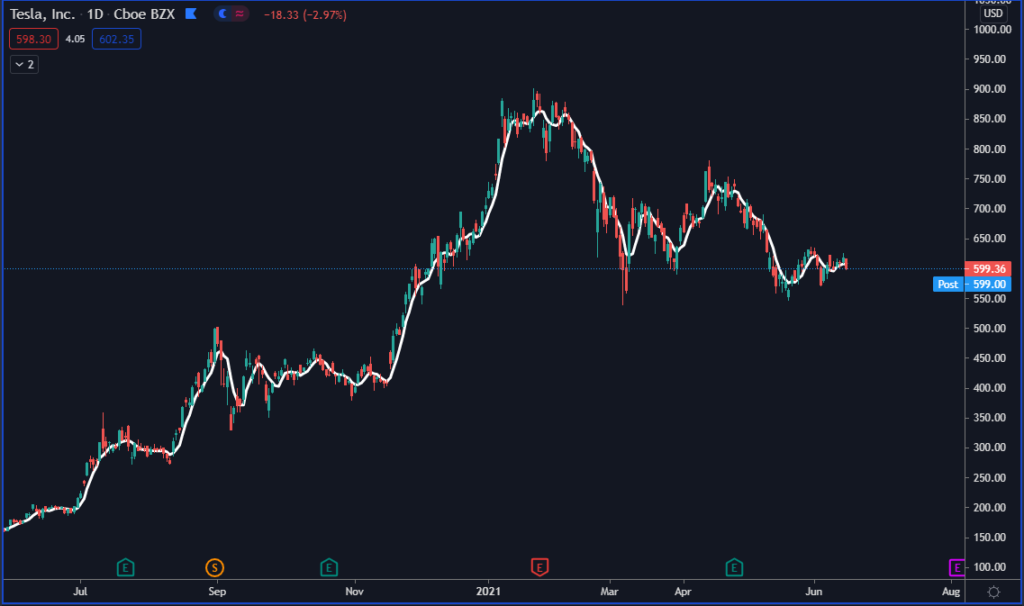
- Second example: It is so late that when it indicates a dominant uptrend, the real trend is already running out. Perhaps, the long-term consensus of the value is not misguided, but you have to have a lot of patience to buy and sell, The third waiting for the price to return to the moving average.
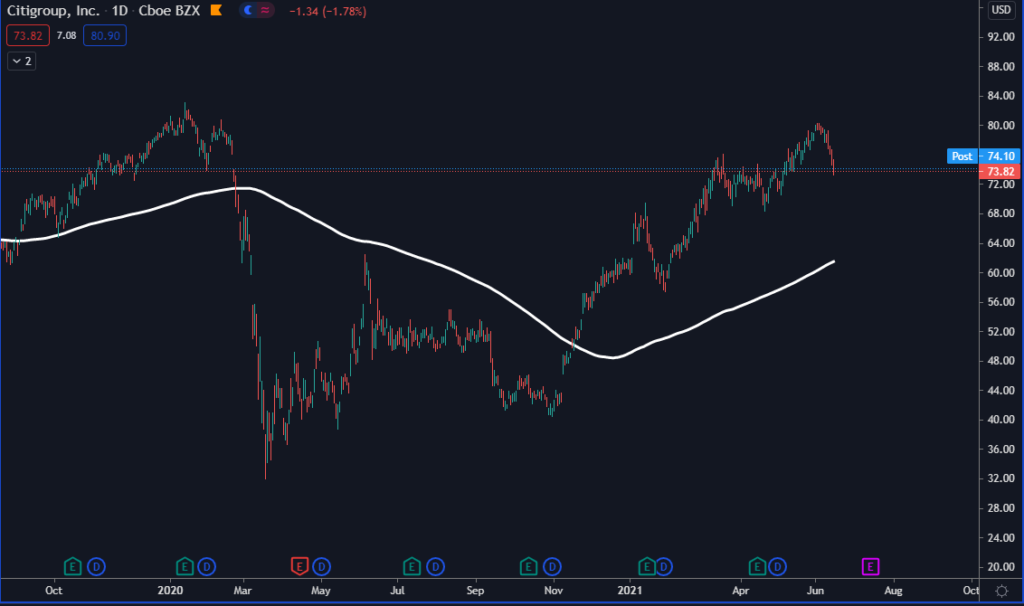
- The third example, well adjusted: shows the current dominant trend without being fooled by price manipulations. Despite everything, it reacts quickly and shows well where the consensus of the value is. You can see how the price is constantly approaching and moving up away (like a bounce on the line).
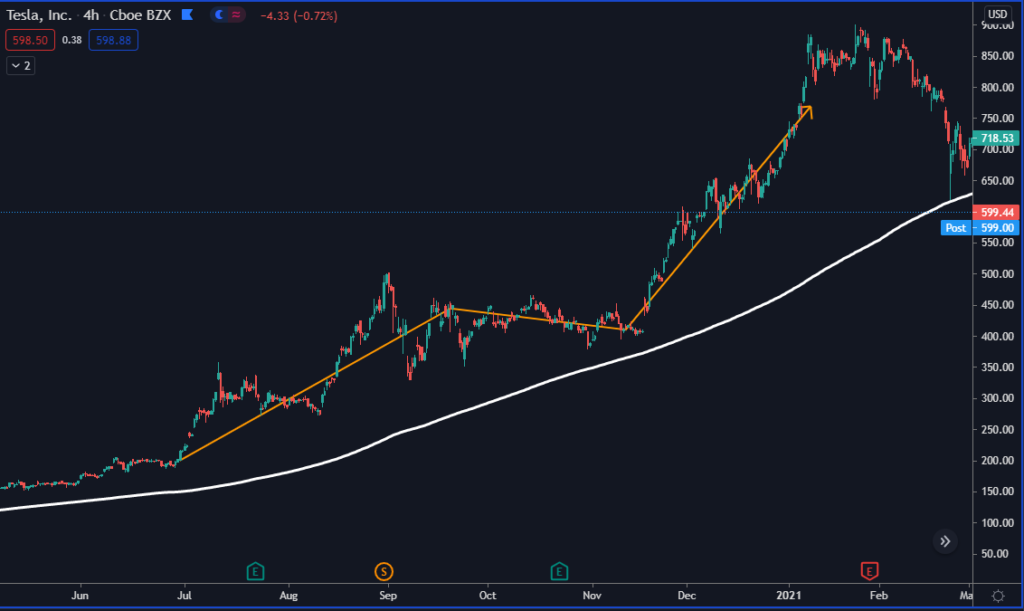
The latter is the type of moving average that you have to see in your charts. Of course, if it bothers you in the analysis, hide it and activate it only to see the data you need.
Moving average crossover strategy, does it really work?
The strategy is about taking two MAs, whose values are different and waiting for their crossing. One of them is usually taken as a fast, and another is usually taken as slow (25 and 50 periods, for example).
Once the two have been configured, wait for them to cross. Normally, the strategy consists of buying when the 25 periods cross with the 50 upwards and selling when the 25 crosses with the 50 downwards.
Here we see an example:
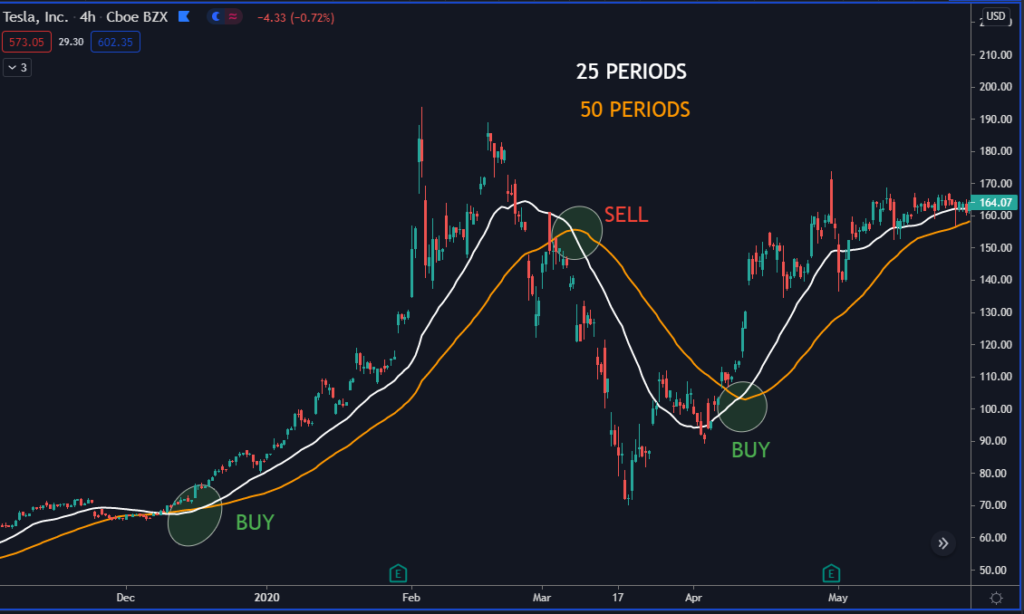
As we can see, it is usually a strategy that, by far, looks great. However, as we have said many times here, in trading, there are no easy solutions. The strategy may seem promising, but you have to be very careful. But why?
When an asset moves in a trend, like an example we saw earlier, everything is great. We see that the two moving averages are kept apart, forming a small separation. At the moment MAs cross, we will close our position. We have an entry point and an exit point with potential profits.
However, it is said that prices move 30% in trend and 70% in range. Statistics are just that, statistics. Some assets may be more trending than others, but what is clear is that ranges are dangerous.
Let’s see this example:
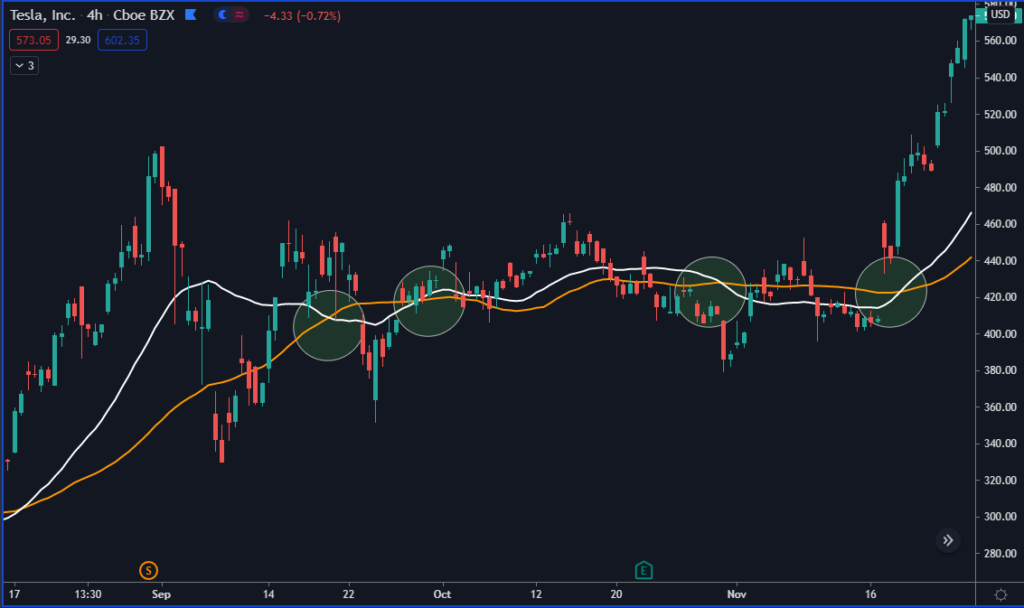
What we see in the ellipses are two averages that do what is called the spaghetti effect, generating false signals. They keep us in and out, making the maximum losing streak increase.
So, let’s be careful with the crosses. It is important to remember that they can be useful, but they are not the definitive solution.
As always, the best thing you can do is good backtesting of their use, and in this way, you will understand what they are for and what they are not for in a short time. In this way, you will be able to incorporate them correctly into your trader’s arsenal.
Conclusions
Trading with moving averages is a valid option for analyzing the market in the medium and long term. Personally, I find them very useful for long-term investments and not for scalping. However, longer period simple moving averages are also applied by some traders in scalping. There are also other strategies involving moving averages.
There is no perfect moving average – neither in the number of periods nor in type. Each MA has to be adapted to specific assets. What is valid for commodities does not have to be valid for currencies or stocks. It is part of our job to analyze and find what best suits our objectives.


