In Forex Trading, MACD or Moving Average Convergence Divergence is considered one of the most potent technical tools used by traders. The indicator is generally used to check the direction as well as the strength of a trend and to define reversal points.
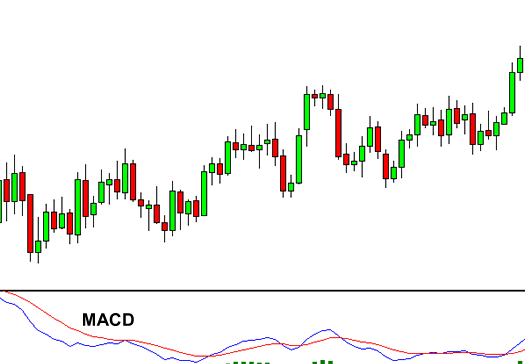
As indicated in the chart above, there are usually three numbers that are used as part of its setting.
- The first number is the required period used to calculate the faster moving average.
- The second number is the required period used to calculate the slower moving average
- The third number indicates the number of bars which are used to calculate the moving average after subtracting the slower moving averages from the faster ones.
It should be noted that there is a common misconception regarding the drawing of lines of the MACD. The two lines drawn do not indicate moving averages and instead indicate the difference between the two moving averages. This can be further explained by the following example
In an MACD chart with parameters 10, 24, 8, the “10” and “24” represent the previous 12 bars of the faster-moving average and the previous 26 bars of the slow moving average, respectively. The previous 9 bars of differences between the two moving averages are indicated by the number 8. This is generally represented by plotting vertical lines known as a histogram.
Here, the faster-moving average shall be calculated as the moving average difference between the two moving averages (10 and 24). The average of the previous MACD line is indicated by the slower moving average. According to the above example, this would be an 8 period moving average. Thus, traders are taking the average of the last eight period of the faster MACD line, plotting it henceforth as the new slower moving average. This is done in an attempt to smoothen out the original line even more, and produces a more accurate line.
As indicative in the chart, the histogram gets bigger when the two moving averages start to separate. Since the faster moving average is moving or diverging away from the slower moving average, the separation is called “divergence”. Similarly, the histogram gets smaller when the moving averages grow closer to each other, which is known as convergence.
Using MACD in Forex Trading
Traders are provided several types of signals when using MACD, some of these are overbought/oversold levels, centerline crossovers, zero line crossovers and divergences. It’s a general rule that the market is said to be bearish when the MACD is below 0 and bearish when it is above 0.
1.Overbought/Over-sold levels:
Traders can use the MACD as an oscillator, as it is common knowledge that the market tends to return to the mean with the Fast-moving average retuning to the slow one.
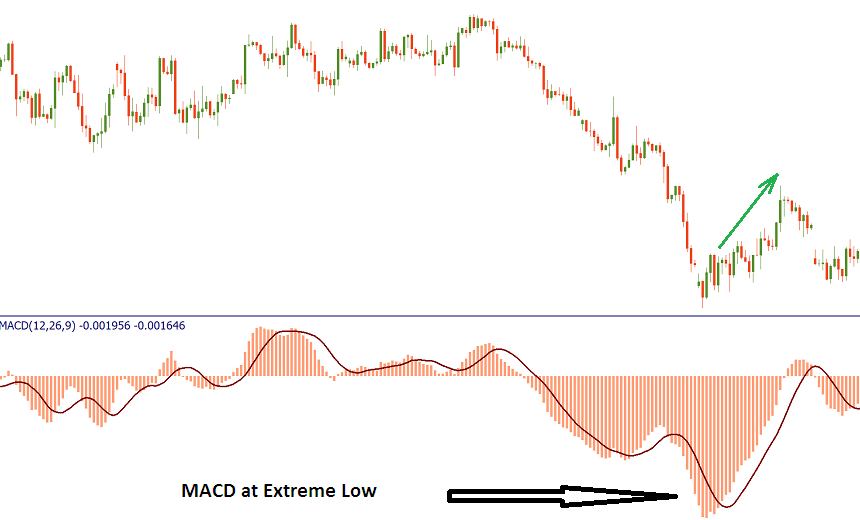
As indicated in the above diagram, the bigger the divergence between the two moving averages, the higher the probability of the price correction that would allow the MACD to return back to 0. Traders can thus trade the extreme highs and lows of the MACD, as it signifies that the market is either overbought or oversold. Traders should judge extremes by studying the comparison of the MACD levels. Such signals require a confirmation from technical indicators such as price action.
2. Zero-line Crossovers:
Zero line crossovers are of two types, bullish and bearish. A Zero line crossover is bullish when the MACD moves above the 0 level and turns positive. Traders use it as a confirmation of an uptrend. On the other hand, a zero line crossover is considered bearish, when the MACD drops below 0 and turns negative. This is usually used to confirm the downtrend.
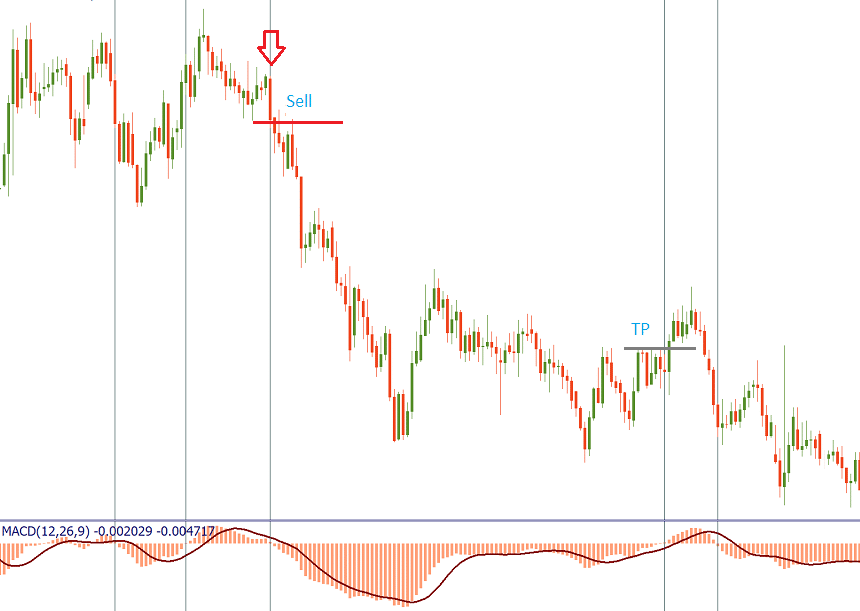
In the above chart, the MACD gives similar trading signals as a two moving average system does. Traders can use a strategy where they can buy when the MACD rises above the 0 level and sell when the MACD falls below the zero level. It should be noted that this approach is profitable only in the presence of strong trends, implementing this during a volatile sideways market, can result in losses.
3. Signal Line Crossovers:
Signal Line crossovers are also either bullish or bearish, A bullish crossover occurs when the MACD increases and goes above the signal line. Similarly, it is called bearish when the MACD starts declining, crossing the signal line towards the downside.
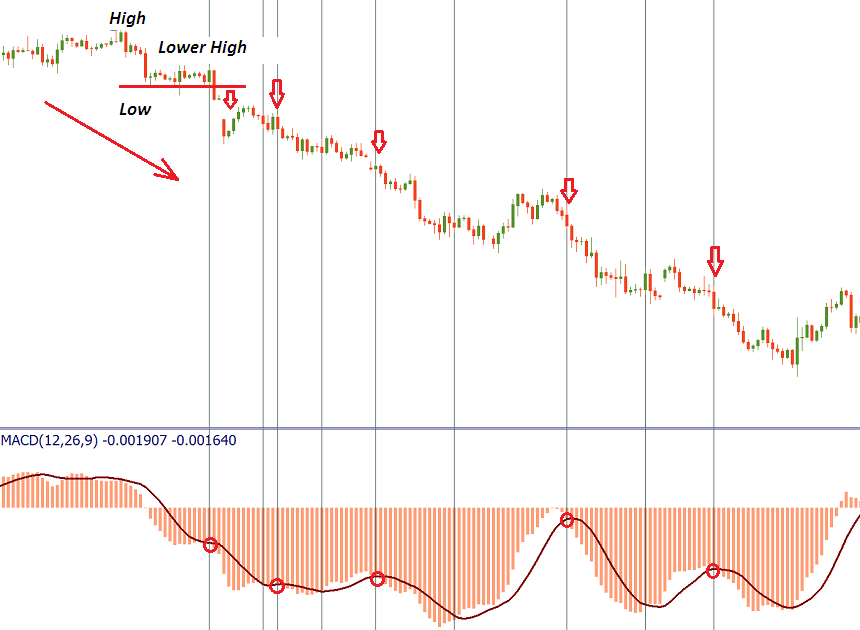
The MACD produces favorable results in trends that have a narrow price range. Traders can thus establish a trend, using only those MACD signals which fall in line with the trend. Thus, in the figure above, it’s clear that only negative MACD crossovers should be traded when in a downtrend with the signal line.
4. Divergences:
Divergence and convergence can also be used to trade. Traders should pay attention to divergence and convergence between the price and the indicator. A convergence is said to be bullish when the price sets lower lows and the minimums of the MACD histogram are higher. A bearish divergence occurs when the price renews the highs, all the while as the MACD maximums become the sell signal.
The MACD is both a trend as well as a momentum indicator. It is a very useful technical indicator that produces a variety of signals, forming the basis of a solid foundation in any trading system.