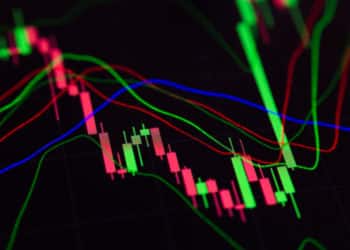
The forex market is never a random or predefined walk, as markets are unpredictable and might not always behave rationally. Forex markets tend to behave in different ways under specific conditions. Often a specific behaviour tends to repeat itself, which means that a certain price pattern can occur again and again. Forex indicators play a role in recognising such patterns as they form. It is necessary to know and understand about forex indicators if you are into forex trading.
Forex technical indicators are mathematical calculations used by the forex traders, according to volume, open interest and exchange rate of a currency pair. Technical traders look at the price of stock while operating the stock market, but forex traders need to check the exchange rates of currency pairs for trading.
Features of a great forex indicator
Not all technical forex indicators are equally popular among forex traders. Some indicators have primary uses, some are used in only very specific cases, while the rest are used regularly.
Simply said, a great forex indicator should have the following features:
- Should be applicable for a maximum number of traders.
- Should provide clear signals that can be observed and used readily.
- Should provide useful information relevant to traders determining the future direction of exchange rates.

Four Important Forex Indicators
Trading on the Forex market is not easy. However, there are many traders who make profitable returns and that too consistently. One of the reasons can be the use of Forex trading indicators. Here is a list of four forex indicators relied upon by the most successful forex traders:
Moving Averages
Moving Averages are one of the best forex indicators. This indicator helps in locating trading opportunities easily for traders so they can move in the right direction of the overall trend. While the forex market is trending up, you can identify the trend and determine the right timing to buy and sell by using the Moving Averages. This indicator is a plotted line that measures the average price of a currency pair within a specific amount of time. For example, you can have the measured average price of the previous year which can help you understand the overall direction better.
There are different Moving Averages strategies you can choose from:
- Moving Average Envelopes Trading Strategy
- Moving Average Ribbon Trading Strategy
- Moving Average Convergence Divergence Trading Strategy (MACD)
- Guppy Multiple Moving Average (GMMA)
Learn more: Moving Average Envelopes and Moving Average Ribbon Trading Strategies
Bollinger Bands
Created in the 1980’s by John Bollinger, Bollinger Bands offer trading signals adapting to market conditions. Bollinger bands or volatility bands are drawn with a provided number of standard deviations surrounding a central moving average. In Bollinger Bands, this moving average is the middle band with two outer bands set 2 standard deviations above and below. The standard deviation changes with the increase and decrease of volatility. When volatility increases, the bands widen automatically. Similarly, they contract when volatility is decreased. The dynamic nature of the bands allows traders to use them on different securities with standard settings. For signals, you can use them for identifying M-Tops and W-buttons and determining the strength of trends.
Learn more: How Bollinger Bands are Used in Forex Trading
Average True Range Indicator (ATR)
Another technical analysis indicator, the ATR measures market volatility by considering any gaps in the price movement. To do this, it decomposes the entire range of an asset price for a specific period. The term ATR was introduced as a measure of volatility by market technician J. Welles Wilder Jr. in his book. The ATR calculation is typically based on fourteen periods that can be intraday, daily, weekly or monthly. If you want to measure recent volatility, then you can use a shorter average like two to ten periods. You will have to use twenty to twenty-five periods for long-term volatility.
This is how ATR works:
- Increased volatility in the market is indicated by an expanding ATR. It also indicates buying pressure or selling pressure. There are lower chances of high ART values being sustained for extended periods.
- A low ATR value, to the contrary, indicates the periods with small ranges. These values are found during extended sideways price action. If the low ATR values are present for a prolonged period, then it indicates the possibility of a continuation move and a consolidation area.
- ATR is useful in signalling changes in volatility. Whereas volatility is not allowed by fixed dollar-point or percentage stops, the sharp price moves or consolidation areas are adapted by the ATR stop which can trigger abnormal price movements in different directions.

Learn more: How to Use Average True Range (ATR) Indicator
The Relative Strength Index (RSI)
The RSI was first published in 1978 and has been used by forex traders ever since. It is currently one of the top technical indicators used by traders. RSI indicator can be computed by comparing the amount of the most recent exchange rate of currency pairs to their most recent exchange rate drops. There is an adjustable time period parameter on the RSI and the default fourteen periods are used by most traders, according to the preference of the famous technical analyst J Welles Wilder who introduced the indicator. The RSI indicator is referred to as a bounded oscillator by the technical analysts because it fluctuates inside a range that has a lower value of 0 and an upper value of 100. When the indicator moves above 70 levels, it is considered that the market is overbought, and when it is below the 30 levels, it is considered oversold.
By learning more about a variety of indicators, a forex trader can easily determine the right strategy to trade and its right time, for any pair of currency, which increases the scope of profit.


