ForexEzy
No Result
View All Result
  • Home
  • Getting Started with Forex
  • Forex Education
    • Forex Basics
    • Forex Trading Strategies
    • Money Management
    • Risk Management
    • Technical Analysis
    • Fundamental Analysis
    • Trading Psychology
    • Social Trading
    • Automated Trading
  • Forex Tools
    • Forex Robots
    • Forex Indicators
    • Forex Signals
  • Top Forex Brokers
  • Top Forex Robots
  • Commentary
  • Blog
No Result
View All Result
ForexEzy
No Result
View All Result
Home Forex Education Technical Analysis

How Bollinger Bands are used in Forex Trading

by Richard Brase
February 26, 2020
in Technical Analysis
0
how bollinger bands are used in forex trading
1
SHARES
11
VIEWS
Share on FacebookShare on Twitter

Bollinger Bands are a popularly used tool for technical analysts and traders alike, in multiple markets including forex. Since forex traders tend to look for incremental moves to profit, recognizing trends and volatility is crucial. Bollinger Bands help traders to find changes in volatility.

Bollinger Bands in Forex

In the forex market, Bollinger bands are an on-chart volatility indicator, consisting of upper and lower bands. These bands react to changes in volatility and are wrapped around the price section in both the upper and lower extremes. The distance between the two bands increases when the volatility of a given currency pair is high. The distance between them decreases when the volatility of a given pair is low. The simple moving average which is of a standard 20 periods can be used to set exit and entry points in trades.

When calculating the Bollinger Bands, the three lines, upper, lower and middle have to be considered.

  • The middle line refers to a 20-period simple moving average, calculated by adding the closing prices of the last 20 periods and subsequently dividing it by 20.
  • The Upper line is calculated as a 20 period Simple moving average of the price action, along with its standard deviation.
  • The lower line is calculated similarly, with the default deviation being 2.

How to Use Bollinger Bands

Apart from being a volatility indicator, Bollinger Bands are quite useful when it comes to discovering support and resistance areas. Here, the double Bollinger bands show the upper and lower bands are selected rather than the centerline for this purpose. There are several signals generated by the Bollinger Band, which is discussed in brief below.

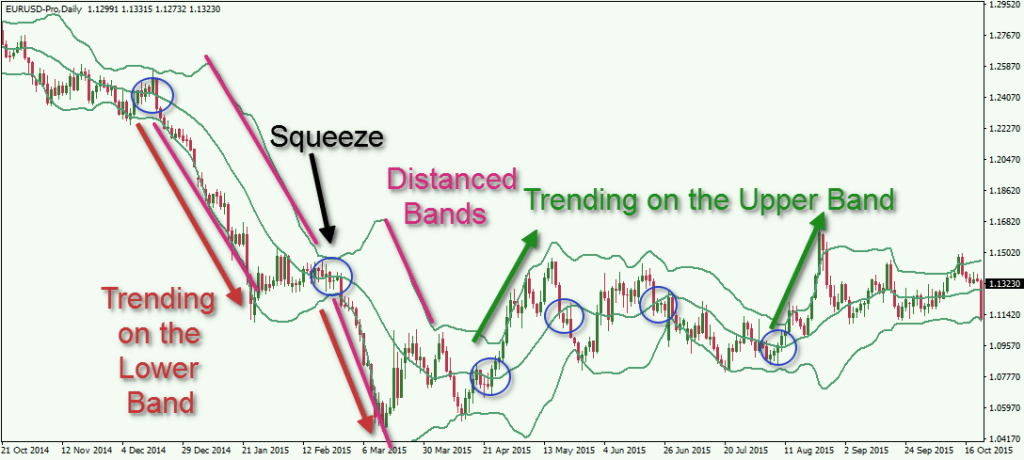
1. When price touches the Lower or Upper Band:  

When the price touches the lower band, it indicates that the price is relatively low or is oversold in case of volatility. A long trading opportunity could thus arise due to a bullish bounce. On the other hand, if the price starts falling quickly at the lower band level, with the distance increasing between the two bands, traders should be skeptical of entering into a long trade. 

Consequently, in the case of the price touching the upper band, traders might consider the upper band as a hidden resistance level based on volatility reading. If the price starts closing above the upper hand, candle after candle, a bullish expansion is expected.

2. Bollinger Band Squeeze:

A Bollinger band squeeze occurs when Bollinger bands come close to each other, signifying that the volatility of a particular forex pair is low. Trading volumes remain comparatively low, with the pair is said to be ranging, rather than trending. In such cases, Traders are advised to avoid trading in very tight price ranges, as they provide less profitable opportunities than during trends. 

how bollinger bands are used in forex trading
Bollinger Squeeze

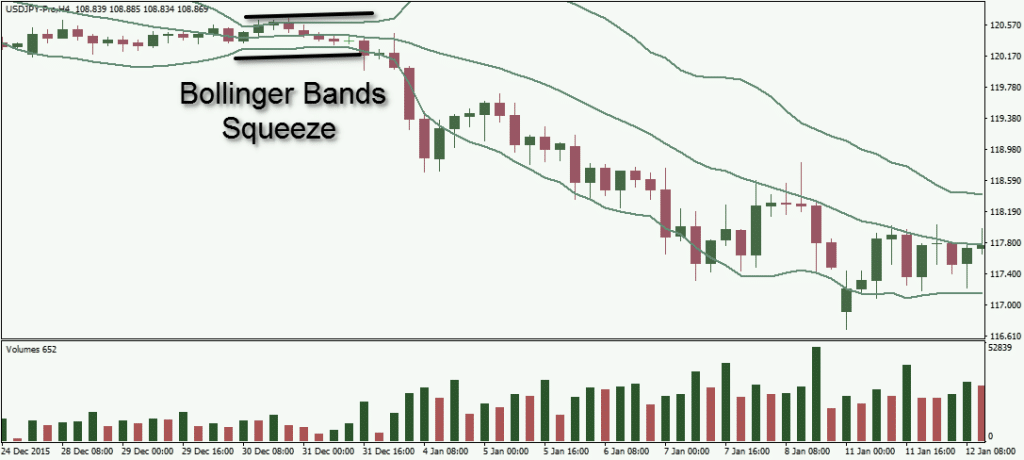
In the chart presented above, we see that the price breakout to the downside after the Bollinger bands squeeze, entering a sustained downtrend as a result. The squeeze is a sign that support in favor of the range-bound market would end soon, with the price is expected to enter into a new trend phase.

3. Bollinger Bands Moving Average breakout:

When a price interaction occurs with the bands, a breakout in the Bollinger bands moving average occurs, which is usually a confirmation signal. Traders get a strong short signal if the price bounces from the upper hand, breaking the 20-period simple moving averages in a bearish direction. Similarly, a strong signal is received when the price bounces from the lower band, breaking the 20-period simple moving average. 

how bollinger bands are used in forex trading
Moving Average Breakout

Traders can thus use the 20 periods simple moving average breakout to set exit points, after they’ve entered a Bollinger bands trade.

Are Bollinger Bands used in Forex? 

Reading Volatility: Bollinger bands tend to converge on moving average, which indicates lower price volatility. These are called “squeezes”. It is ideal for spotting trend changes without even concentrating on political or national news that could affect a currency pair. For instance, the USD/JPY pair experienced a squeeze as of 3.10.2014 as a result of news that the Bank of Japan had increased its stimulus bond-buying policy. 

  • The trend change could’ve been spotted if a trader used the Bollinger band squeeze, even if he/she had not heard about the news.
  • Setting Limits: Forex Traders can use the bands to place buy orders at the lower band limit and sell orders at the upper band limit. This strategy is ideal for currencies that follow range patterns. However, a trader can experience substantial losses if a breakout occurs.

There are different ways in which Bollinger Bands could be used in the Forex market, including several strategies. These are all profitable trading strategies in theory, but still, require much education and trading discipline for traders to be successful.

Tags: bollinger bands
Share1Tweet
Previous Post

How to Use Parabolic SAR for Profitable Trades

Next Post

How to Use Technical Analysis for Forex Forecasting

Related Posts

An Introduction To Forex Indicators

An Introduction To Forex Indicators

by Chintan Patel
January 1, 2021
0

What are the Forex indicators? A vast part of technical analysis is understanding and trading with these tools. Although they...

Using Trendlines and Saucer Formations in Trading

Using Trendlines and Saucer Formations in Trading

by Tim Baudin
December 21, 2020
0

Trendlines are those lines that you can recognize easily. A trader draws trendlines on charts in order to connect a...

RSI - Top 3 Real Charts You've Missed

RSI – Top 3 Real Charts You’ve Missed

by Tim Baudin
December 17, 2020
0

Overview Are you still doubting the power of the RSI? This article will cover three recent forex trading opportunities mostly...

The Trading Indicator You Have not Heard of – The Williams %R

The Trading Indicator You Have not Heard of – The Williams %R

by Adam Stanley
December 1, 2020
0

The Williams Percentage Range is a highly effective tool that measures price variations over a period of time for various...

How to Use Technical Analysis in the Market?

How To Use Technical Analysis In The Market?

by Adam Stanley
November 25, 2020
0

If you are trading in the market, you’ll know that uncertainty and risk lurk at every step. In such a...

Load More

Leave a Reply Cancel reply

Your email address will not be published. Required fields are marked *

Best Forex EA

  • ROFX 9/10
  • Forex Fury 8/10
  • FXgoodway 7.5/10
  • Z Trader FX EA 7/10
  • Forex Incontrol Reborn 6.5/10

Popular News

  • The Best RSI and CCI Combination Trading Strategy for Optimum Returns

    The Best RSI and CCI Combination Trading Strategy for Optimum Returns

    2 shares
    Share 2 Tweet 0
  • Rofx Review – High Profitability and Stable Performance Analysis

    29 shares
    Share 29 Tweet 0
  • The Best Forex Scalping Strategy – Using 3 Popular Technical Indicators

    0 shares
    Share 0 Tweet 0
  • The Best MT4 Indicators & Expert Advisors For Forex Trading

    2 shares
    Share 2 Tweet 0
  • How to check if the indicator is repainting?

    2 shares
    Share 2 Tweet 0

Trading

Footer

We are dedicated to demystify the world of forex trading for you – no matter what level you are on.

Categories
  • Automated Trading
  • Day Trading
  • Forex Basics
  • Forex Brokers
  • Forex Education
  • Forex Forecasts
  • Forex Indicators
  • Forex Market Commentary
  • Forex Robots
  • Forex Signals
  • Forex Tools
  • Forex Trading Strategies
  • Fundamental Analysis
  • Money Management
  • News
  • Risk Management
  • Social Trading
  • Technical Analysis
  • Top World Traders
  • Trading Psychology
  • Uncategorized
Tags
arbitrage atr bollinger bands cci chart patterns classics copy trading courses day trading forex brokers forex charts forex ea forex education forex forecasting Forex Indicators forex software reviews grid trading hedging ichimoku macd market cycles news trading oscillators price action trading rsi social trading strategies tips & tricks trading bots trading platforms trend trading Video
  • Terms of Use
  • Privacy Policy
  • Compensation Disclosure
  • Risk Disclosure
  • About Us
  • Contact Us

Copyright © 2020 by ForexEzy.com

No Result
View All Result
  • Home
  • Getting Started with Forex
  • Forex Education
    • Forex Basics
    • Forex Trading Strategies
    • Money Management
    • Risk Management
    • Technical Analysis
    • Fundamental Analysis
    • Trading Psychology
    • Social Trading
    • Automated Trading
  • Forex Tools
    • Forex Robots
    • Forex Indicators
    • Forex Signals
  • Top Forex Brokers
  • Top Forex Robots
  • Commentary
  • Blog

© 2020, Forexezy.