In the world of Forex, technical analysis refers to the method by which price movements and future market trends are predicted, based on studying charts of past market actions. It is generally concerned with what has occurred in the market, rather than predicting or forecasting what will happen in the future. Technical analysis takes into account, both the volume of trading as well as well as the price of the instruments used. Charts are then created from this data and used as the primary tool. Technical analysis can allow experienced analysts to follow several markets as well as instruments, simultaneously.
The Principles of Technical Analysis
In Layman’s terms, technical analysis thus refers to the practice of predicting price movements and future market trends by studying charts. It is mainly based on three essential principles, which are explained in brief below.

Market Action
It is a well-known fact that the actual price is reflective of all the factors present in the market that could affect the price, such as political factors, supply and demand and market sentiment. However, the technical analysis only considers the price movements and not the reasons for any change.
Prices tend to move in trends
Technical analysis is mainly used by traders to identify patterns of market behaviour, which would otherwise be regarded as significant. There are several patterns that have high probability of producing the expected results. Consequently, there are recognised patterns which tend to repeat themselves consistently.
History repeats
Since human psychology has changed little over the last 100 years, forex chart patterns are considered reliable. They have been recognised and categorised for over 100 years with reliable results.
Technical analysis for forex depends on five elements which are Indicators, Waves, Gaps, Trends and Number Theory.
How to conduct technical analysis in Forex
In Forex, technical analysis is concerned with the identification of patterns and determining probabilities of future movements, harnessing the power of technical studies, tools and indicator along the way. It can be divided into two parts: Identifying Trends and Identifying support/resistance levels with the use of price charts and time frames.
Identifying Trends
Trends can be best described as the direction of prices and can be either uptrends or downtrends depending on some factors. For instance, falling peaks and troughs indicate a downtrend, which in turn determines the steepness of the current trend. On the other hand, rising peaks and troughs indicate an uptrend. A trend reversal is usually formed when a trend line is broken.
Some of the most common tools used while using trends include
- Directional movement Indicator or DMI, which is a popular technical indicator which determines whether a particular currency pair is trending.
- Coppock Curve, which is a tool used for predicting lows in the bear market.
Identifying support/resistance levels
Support refers to a particular price level where a downtrend is expected to pause. Resistance arises when price increase and a sell-off occurs. Both Support and Resistance are crucial tools used in technical analysis. They are focused in by traders on every time frame, intra-day, or on a daily, weekly or monthly basis. Having knowledge of these levels help traders stay on the correct side of the market.
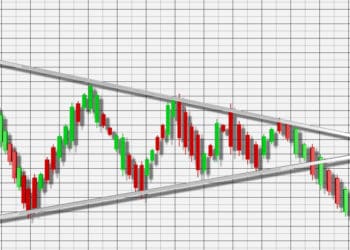
It should be remembered that in Forex, both these levels are not fixed and rather fluctuate. In any chart depicting channel lines, the top line refers to the resistance line or ceiling price, while the bottom line is the support line or floor price. They are used for confirming the formation of a trend, and to detect whether a trend has reversed itself.
Major benefits of using Technical analysis for forex trading
Technical analysis is increasingly used by the forex trading community because of the host of advantages it provides. Some of them are mentioned in brief below.
- Provides early signals: It provides early signals, allowing traders to paint a picture about the psychology of traders and investors in the market. Price volume analysis can also provide the direction of the movement of the market makers, based on a particular market.
- Less Expensive: Technical analysis is comparatively less expensive than other methods because of the vast number of companies that provide free charting software.
- Faster: Technical analysis can provide quick results for traders using 1 minute, 5 minutes or 30 minutes charts
- Analysing Trends: Technical analysis helps traders and investors to form accurate predictions about the trend of the market. It helps them to spot uptrends, downtrends and sideways moves of the market.
Conclusion
Technical analysis is crucial for traders conducting short-term, swing and even long-term trading. Traders are provided with important information such as support and resistance levels, the momentum of the market, market volatility, as well as a clear picture of the trader’s psychology. Thus, traders looking to earn big in the forex market should understand the nitty-gritty of conducting technical analysis during forex trading.


