ForexEzy
No Result
View All Result
  • Top Forex Advisors
    • Best Forex Robots
    • Best Forex Signals
    • Best Managed Accounts
  • Top Forex Brokers
    • Best Forex Brokers
    • US Forex Brokers
    • UK Forex Brokers
    • MT4 Forex Brokers
    • MT5 Forex Brokers
    • Zero Spread Brokers
    • Best PayPal Brokers
    • TradingView Brokers
    • Social Trading Platforms
  • Top Review Platforms
  • Forex Education
    • Getting Started
    • Forex Basics
    • Forex Trading Strategies
    • Money Management
    • Risk Management
    • Technical Analysis
    • Fundamental Analysis
    • Trading Psychology
    • Social Trading
    • Automated Trading
  • Forex Tools
    • Forex Robots
    • Forex Indicators
    • Forex Signals
    • Forex VPS
  • Forex Forecast
  • Crypto
    • Best Crypto Exchanges
    • Best Crypto Bots
    • Crypto Guides & Forecasts
No Result
View All Result
ForexEzy
No Result
View All Result
The World’s Leading Social Trading Platform
Try now
Home Forex Tools Forex Indicators

How to Use Parabolic SAR for Profitable Trades

by Chintan Patel
February 25, 2020
in Forex Indicators, Technical Analysis
0
Explaining the Parabolic SAR
1
SHARES
11
VIEWS
Share on FacebookShare on Twitter

In forex trading, there are two types of analyses on which traders lean to find profitable entry and exit trading points. On the one hand, fundamental analysis focuses on economic data that may influence the price of a currency. Particularly, this analysis identifies the driving force behind the direction of price. On the other hand, technical analysis entails using best forex indicators to identify the direction of the price of an asset.

However, there are different types of indicators, each with a specific function. For example, the momentum indicators tell the trader when an asset is in an oversold or overbought position. With such information, the trader can easily anticipate an impending trend. The relative strength indicator (RSI) is a good example of this group of indicators. Also, there are indicators that depict the volume price movements for a particular asset. The Money Flow Index is a good example of a volume indicator.

Thirdly, there are volatility indicators that identify dramatic changes in price movements and volume of the movements. Lastly, there are indicators that identify the trend of price movements of forex products. A good example of trend indicators is the Parabolic SAR, which is the subject of this article.

The Best Forex Robots Report Is Already Here!
best forex robots
Check out 30+ best expert advisors with daily updated live results and statistics
Click Here

Explaining the Parabolic SAR

This is one of the best forex indicators for automated trading. In the first place, the indicator determines the direction of the price movement of a currency pair. This means the indicator facilitates the identification of bullish and bearish trends. In the second place, the Parabolic SAR indicator enables a trader to anticipate reversal of the trend of a currency pair. As a result, traders also know the indicator as a Stop And Reverse (SAR) system.

Nonetheless, such an indicator is only useful in markets that show a distinguishable trend. Since the indicator reacts to trend reversals, it is ideal for establishing the direction of a trend. In addition, the indicator is helpful in terms of identifying potential entry and exit point of a trade. However, the indicator is incapable of determining the strength of a trend. Therefore, it is advisable to use complimentary indicators (like the RSI) to measure the trend’s strength.

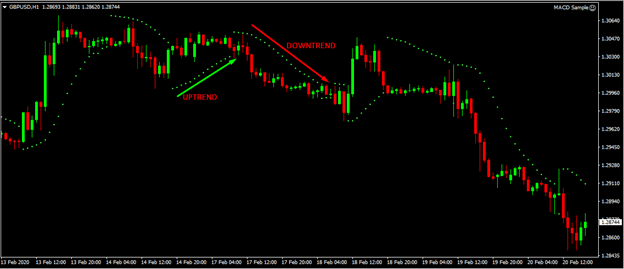
On the chart, the indicator appears as a dot. It is one of the easiest forex charting tools to follow. The Parabolic SAR indicator behaves differently during a downtrend and an uptrend. During a downtrend, the SAR appears above the price bars. As such, the indicator is ideal for showing the trader where a trailing stop in a downtrend should be. On the contrary, the SAR appears below the price bars in an uptrend. Similarly, the SAR is a good indicator of where the trailing stop loss should be in an uptrend.  

Explaining the Parabolic SAR

Using the Parabolic SAR

Clearly, the Parabolic SAR is ideal for automated forex trading. This is because it helps to identify potential trading points automatically. Also, forex expert advisors can use the indicator to provide signals with ease.

Looking at the chart below, the trend of the SAR changes immediately; the dot touches the price bar. On the green line (signifying the uptrend), the dots progress until the last one touches the red candle. Immediately, the trend reverses into a downtrend. Here, you can enter a new position the moment the dot touches the candlestick. If the dot is on the lower side of the candlestick, it means you can sell. If the dot is on the upper side of the price bar, you can buy.

how to use parabolic sar for profitable trades

As you can see, the Parabolic SAR itself appears as a perfect stop loss and target profit marker. In an uptrend, the dots align themselves on the lower side. Apparently, the stop loss trails the trend as far as it goes; hence, the Parabolic SAR acts as a perfect trailing stop loss. Therefore, the indicator prevents you from pulling the trigger too early such that you can squeeze as many pips as possible during a trade.

On the other hand, the Parabolic SAR is a good indicator for the trailing profit level. Usually, human traders are overcome by fear of losing profits or too much excitement, which may lead to an early exit. As a result, the trader may fail to earn optimum profits. The Parabolic SAR, therefore, indicates where the ideal trailing profit level should be for optimum profits. Therefore, you should not exit the trade position as long as the Parabolic SAR dot has not touched the price bar for optimum profits.  

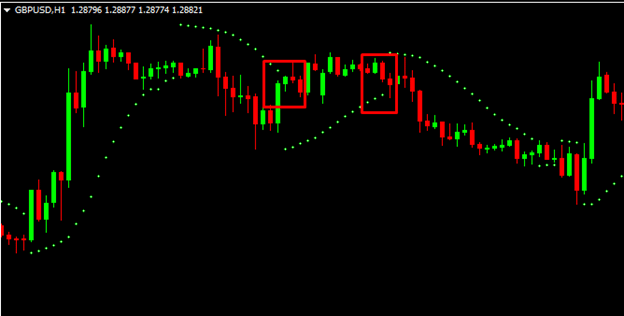
What happens when the Parabolic SAR gives wrong signals?

To be sure, the Parabolic SAR indicator identifies the trend, which makes it unreliable in a market that moves sideways. Usually, the indicator shows a long-term trend, which makes it not good for short-term traders. However, you can get around this demerit by complimenting indicator with other indicators.

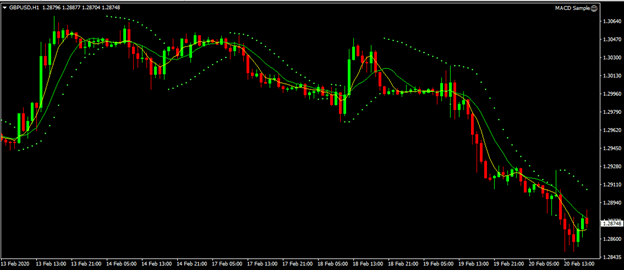
For example, you can use the Parabolic SAR alongside the 5-period and the 10-period Moving Average indicators. These two are the best forex indicators that identify a trend as well as the trend reversal point. In the screenshot below, you will notice that the 5-period (yellow line) and 10-period (green line) MAs cross before a new trend sets in. Therefore, the indicators help the trader to take caution when the Parabolic SAR is giving false signals.

how to use parabolic sar for profitable trades
The Best Forex Robots Report Is Already Here!
best forex robots
Check out 30+ best expert advisors with daily updated live results and statistics
Click Here
Tags: Forex Indicators
Share1Tweet
Previous Post

The Four Important Forex Indicators Every Trader Should Know

Next Post

How Bollinger Bands are used in Forex Trading

Related Posts

How to Rip Profits with Custom Indicators on MT4

How to Rip Profits With Custom Indicators on MT4

by Adam Stanley
February 3, 2022
0

Indicators are important tools that day traders and investors use to predict the direction of a financial asset like stocks,...

Technical Indicator Implementation in Forex vs. Crypto: Step by Step Guide

Technical Indicator Implementation in Forex vs. Crypto: Step by Step Guide

by Tim Baudin
January 31, 2022
0

Technical analysis is crucial for anyone looking to gain an edge while trading any market, be it forex, stock, or...

Trading With Balance of Power Indicator

Trading With Balance of Power Indicator

by Adam Stanley
December 9, 2021
0

The Balance of Power (BOP) indicator is an analysis tool created by Igor Livshin in August 2001. It tracks the...

What Are Pennant Chart Patterns in Forex: Step by Step Guide

What Are Pennant Chart Patterns in Forex: Step by Step Guide

by Chintan Patel
November 15, 2021
0

Continuation patterns in the forex market are a common occurrence whenever there is a large movement in one direction followed...

How To Trade Ascending Scallops in Forex

How To Trade Ascending Scallops in Forex

by Adam Stanley
November 10, 2021
0

Price in the Forex market does not always move in one direction. After a significant move in one direction, up...

Load More

Leave a Reply Cancel reply

Your email address will not be published. Required fields are marked *

Best Forex Automated Systems

  • TechBerry 9/10
  • Happy Galaxy 8.5/10
  • Forex Cyborg 8.5/10
  • Forex Fury 8/10
  • FXgoodway 7.5/10
  • Best Forex Brokers
  • Best Forex Robots
  • Best Forex Signals
  • Best Forex Managed Accounts

Top Trading Markets

We are dedicated to demystify the world of forex trading for you – no matter what level you are on.

Categories
  • Automated Trading
  • Crypto Robot Review
  • Cryptocurrency Trading
  • Day Trading
  • Forex Basics
  • Forex Brokers
  • Forex Education
  • Forex Forecasts
  • Forex Indicators
  • Forex Market Commentary
  • Forex Robots
  • Forex Signals
  • Forex Signals
  • Forex Tools
  • Forex Trading Strategies
  • Forex VPS
  • Fundamental Analysis
  • Managed Accounts
  • Money Management
  • News
  • Review
  • Review Platforms
  • Risk Management
  • Social Trading
  • Technical Analysis
  • Top World Traders
  • Trading Apps
  • Trading Psychology
  • Uncategorized
Tags
Acquisition AI Amazon Apple Artificial Intelligence Bitcoin bond yields CEO China earnings earnings report economy Electric Vehicles Federal Reserve financial performance Financial Results forex ea forex software reviews Growth Guidance Housing Market inflation interest rates Investing investment Investors Market Volatility merger mortgage rates net profit Nvidia Oil prices Q2 Results revenue Revenue Growth Sales sales growth Stock Futures stock market stock performance Stocks strategies technology Tesla Video
  • Terms of Use
  • Privacy Policy
  • Compensation Disclosure
  • Risk Disclosure
  • About Us
  • Contact Us

Copyright © 2023 by ForexEzy.com

No Result
View All Result
  • Top Forex Advisors
    • Best Forex Robots
    • Best Forex Signals
    • Best Managed Accounts
  • Top Forex Brokers
    • Best Forex Brokers
    • US Forex Brokers
    • UK Forex Brokers
    • MT4 Forex Brokers
    • MT5 Forex Brokers
    • Zero Spread Brokers
    • Best PayPal Brokers
    • TradingView Brokers
    • Social Trading Platforms
  • Top Review Platforms
  • Forex Education
    • Getting Started
    • Forex Basics
    • Forex Trading Strategies
    • Money Management
    • Risk Management
    • Technical Analysis
    • Fundamental Analysis
    • Trading Psychology
    • Social Trading
    • Automated Trading
  • Forex Tools
    • Forex Robots
    • Forex Indicators
    • Forex Signals
    • Forex VPS
  • Forex Forecast
  • Crypto
    • Best Crypto Exchanges
    • Best Crypto Bots
    • Crypto Guides & Forecasts

© 2023, Forexezy. {copy} {year}