ForexEzy
No Result
View All Result
  • Top Forex Advisors
    • Best Forex Robots
    • Best Forex Signals
    • Best Managed Accounts
  • Top Forex Brokers
    • Best Forex Brokers
    • US Forex Brokers
    • UK Forex Brokers
    • MT4 Forex Brokers
    • MT5 Forex Brokers
    • Zero Spread Brokers
    • Best PayPal Brokers
    • TradingView Brokers
    • Social Trading Platforms
  • Top Review Platforms
  • Forex Education
    • Getting Started
    • Forex Basics
    • Forex Trading Strategies
    • Money Management
    • Risk Management
    • Technical Analysis
    • Fundamental Analysis
    • Trading Psychology
    • Social Trading
    • Automated Trading
  • Forex Tools
    • Forex Robots
    • Forex Indicators
    • Forex Signals
    • Forex VPS
  • Forex Forecast
  • Crypto
    • Best Crypto Exchanges
    • Best Crypto Bots
    • Crypto Guides & Forecasts
No Result
View All Result
ForexEzy
No Result
View All Result
The World’s Leading Social Trading Platform
Try now
Home Forex Tools Forex Indicators

Technical Indicator Implementation in Forex vs. Crypto: Step by Step Guide

by Tim Baudin
January 31, 2022
in Forex Indicators
0
Technical Indicator Implementation in Forex vs. Crypto: Step by Step Guide
0
SHARES
11
VIEWS
Share on FacebookShare on Twitter

Technical analysis is crucial for anyone looking to gain an edge while trading any market, be it forex, stock, or even cryptocurrencies. The use of indicators and other tools to try and understand past price action to try to predict the future is at the heart of such analysis.

The Best Forex Robots Report Is Already Here!
best forex robots
Check out 30+ best expert advisors with daily updated live results and statistics
Click Here

Crypto vs. Forex

Trading platforms come with various indicators and tools that traders use to analyze the forex and crypto markets. The basic mechanism used to analyze the two markets is the same. The only difference comes from the tools used, given the nature of the markets.

The cryptocurrency market differs from forex on the heightened levels of volatility in play. High volatility sees most cryptocurrencies experience wild price swings that, at times, make it difficult to determine the direction the market is moving. However, volatility makes it easy for traders to make huge profits over short periods.

chart showing volatility disparity between forex and Crypto

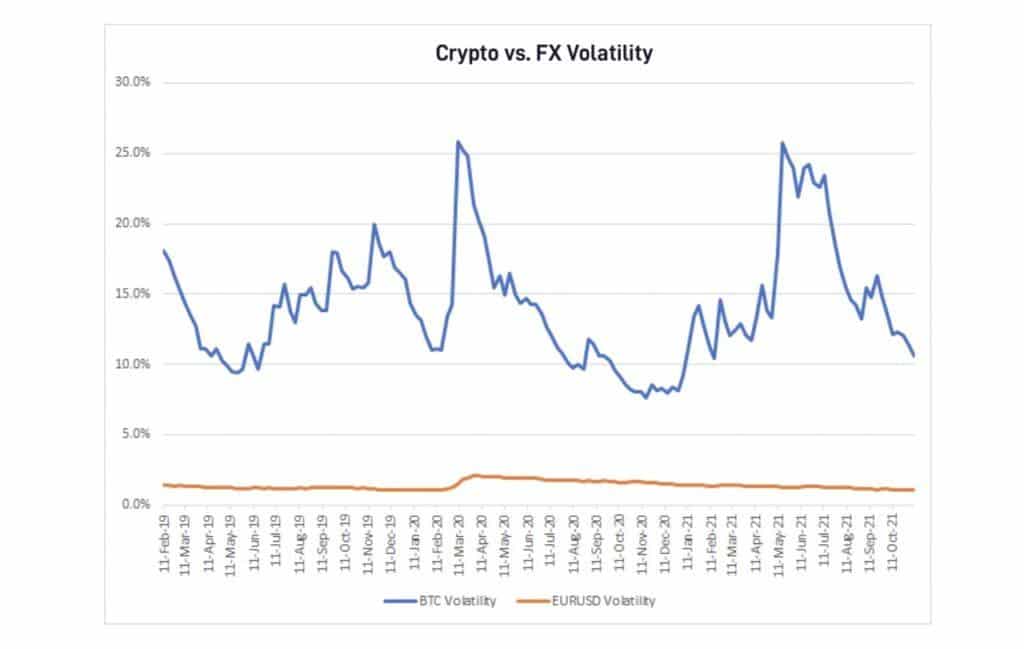
In contrast, the forex market is relatively stable while dealing with major and minor currencies. It is unlikely to see currency pairs fluctuating by up to 10% on a single day, which is common in the cryptocurrency market.

Volume is another important aspect to consider while trading forex and the crypto markets. While forex boasts of some of the highest volumes, the rate at which volume around most cryptocurrencies fluctuates is of great importance.

Volume fluctuation around cryptocurrencies is a big deal that should always be considered while carrying out technical analysis. For this reason, it is important to leverage specific volume tools for cryptos as compared to the forex market.

Below are some of the best indicators for trading the crypto and forex market.

On Balance Volume

Volume is an important aspect that dictates how price moves and is likely to continue moving. The On-Balance-Volume indicator is an important technical analysis tool for crypto trading as it measures coins buying and selling pressure. The indicator considers the total volume in cryptocurrency over a span of days, weeks, or even months.

Chart showing  increasing OBV

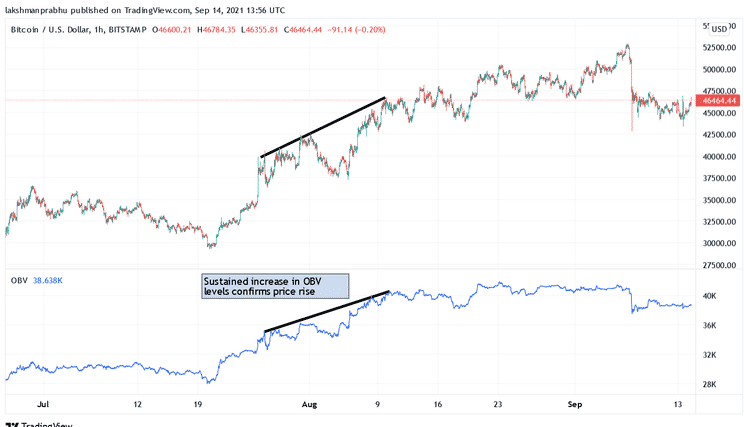
Whenever the OBV reading is increasing, it means more people are buying a given cryptocurrency at the prevailing price. This acts as a good indicator signaling that price is likely to increase given the bullish biases.

Chart showing  decreasing OBV vs. price action

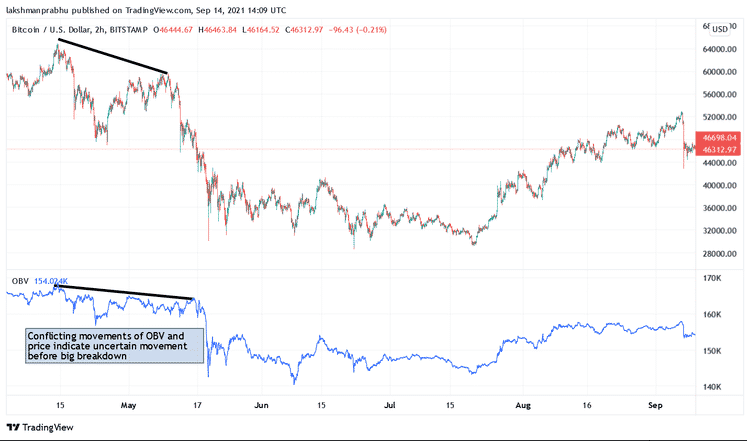
Similarly, whenever the OBV reading is decreasing, it means the selling pressure in the market is high. Given such development often takes place at all-time highs, traders can use this opportunity to enter a short position as it affirms the crypto price is likely to continue edging lower.

Accumulation/Distribution Line

The ADL is an important indicator that can be used with the OBV. It stands out partly because it affirms how a given cryptocurrency is trending by factoring in price and trading price as it measures the flow of money in and out of the underlying asset.

Whenever the A/D line and the prices move up, it implies that bulls are in control, affirming the bullish sentiment. In this case, one can look to enter long positions to profit from further price spikes. Likewise, when both price and the A/D line are facing down, it means bears are in control, affirming the bearish sentiment in the market. In this case, one can look to enter short positions.

Chart showing  a buildup of selling pressure on A/D line indicator

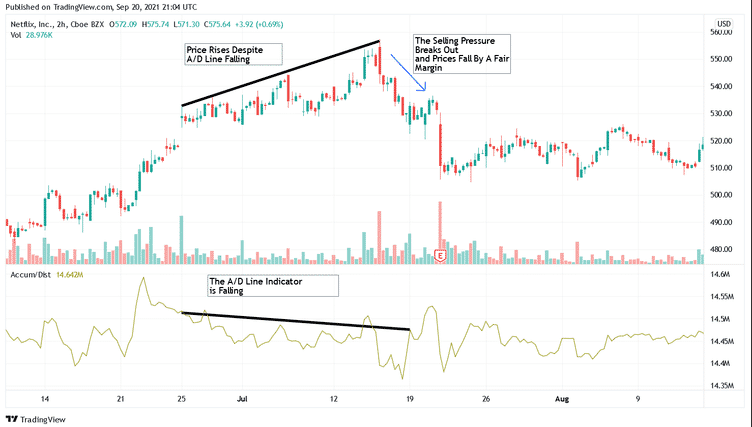
In addition, whenever the A/D line edges lower but the price continues increasing, it affirms divergence. This means that a correction is likely to happen, resulting in price correcting and starting to move lower. Similarly, whenever the A/D line moves up, and price falls, divergence is also affirmed, signaling a buildup in buying pressure which indicates more buyers are buying; this could cause the price to rerate higher.

Moving Average Convergence-Divergence indicator

The relative stability of the forex market often sees traders resort to using the MACD indicator in technical analysis. The indicator leverages two Moving Averages allowing traders to get insight into the momentum of trends.

Chart showing crossover in  MACD indicator

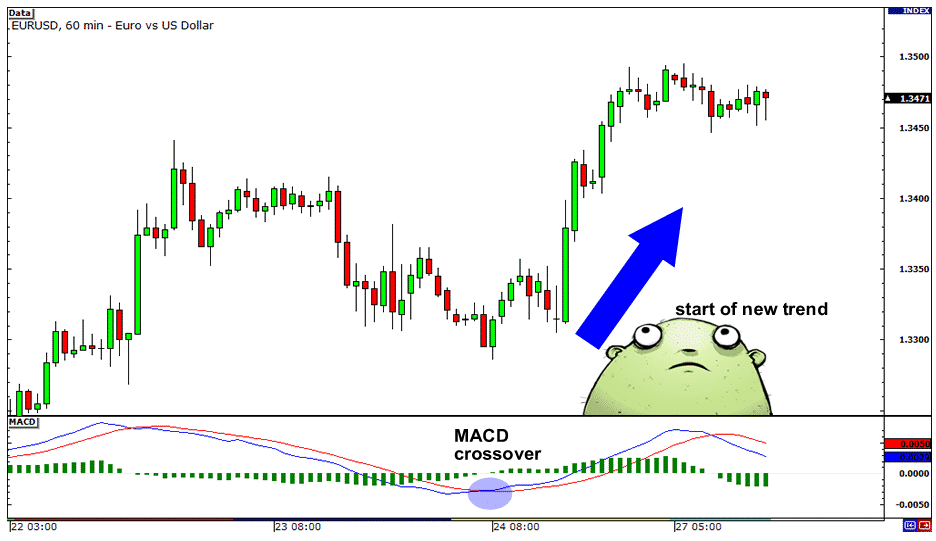
The indicator comes with two Moving Averages, one that is slow-moving and one that is fast-moving. Conversely, when the fast-moving average moves up, crossing the slow-moving MA and above the zero line, the same implies a buildup in buying pressure. This means that buyers are accumulating positions and that of the underlying currency pair is likely to continue edging higher.

Likewise, whenever the fast-moving MA moves lower, crossing the slow-moving MA and edges below the zero line territory, it signals a buildup in selling pressure. With short sellers accumulating positions, the likelihood of price edging lower is usually high. Consequently, forex traders use this opportunity to enter short positions.

Momentum indicators for forex

The relative stability of the forex market compared to the crypto market makes it easy to track the direction in which the market is moving and key levels. Momentum indicators such as Relative Strength Index RSI and Stochastic oscillator help in the measuring of strength or weakness associated with price movements

In addition, the indicators provide some of the best trading signals depending on the direction they move. For instance, the RSI comes with readings of between 0 and 100. A currency pair is said to be trending up whenever the RSI reading is above 50, signaling a buildup in buying pressure. Similarly, it is bearish and likely to continue making lower lows whenever the reading is below 50.

chart showing RSI oversold and overbought

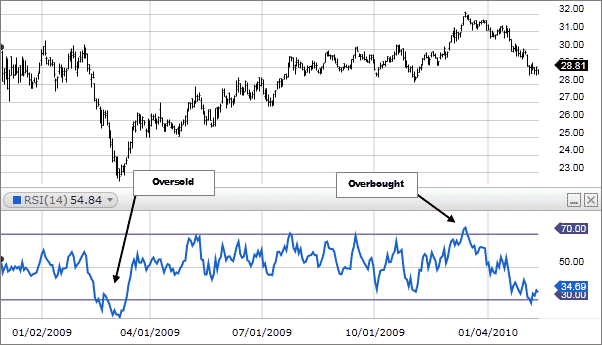
Additionally, the 30 and 70 levels are of great importance as they signal prevailing market conditions. For instance, whenever the RSI reading is above 70, the underlying currency pair understudy is said to be overbought. In this case, caution is usually of the essence as a correction may often come into play. Likewise, when the reading is below 30, the asset is oversold, signaling potential correction to the upside.

chart showing divergence in RSI

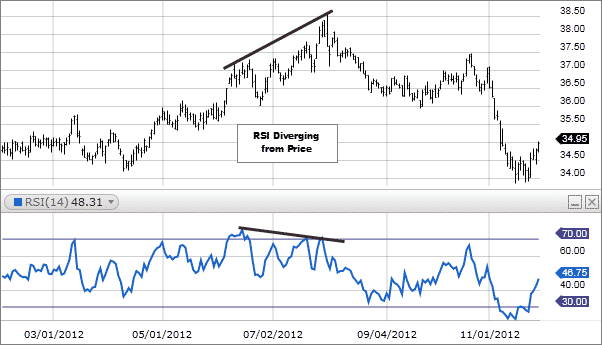
When the RSI and price are not moving in the same direction, divergence is said to be in play, signaling potential price reversal. For instance, when the RSI is moving up and making higher lows while the price is trending lower, the prospect of a price reversal occurring to the upside is usually high.

The Best Forex Robots Report Is Already Here!
best forex robots
Check out 30+ best expert advisors with daily updated live results and statistics
Click Here
ShareTweet
Previous Post

Trading the Forex Ocean Using Elliott Waves

Next Post

How to Use Hedging Strategy in Forex vs. Crypto

Related Posts

How to Rip Profits with Custom Indicators on MT4

How to Rip Profits With Custom Indicators on MT4

by Adam Stanley
February 3, 2022
0

Indicators are important tools that day traders and investors use to predict the direction of a financial asset like stocks,...

TJ10X Forex Indicator

TJ10X Forex Indicator Review

by Chintan Patel
September 28, 2021
0

TJ10X Forex Indicator is an MT4 tool developed by the SinryAdvice company. It provides signals for multiple currency pairs and...

The Fall Indicator

The Fall Indicator Review

by Adam Stanley
September 27, 2021
0

The Fall indicator provides trading signals for traders and provides desktop and mobile alerts for traders. The algorithm does not...

Pipbreaker

Pipbreaker Review

by Adam Stanley
September 16, 2021
0

Pipbreaker claims to be the best indicator for MT4 and the most efficient way to trade manually. As per vendor...

An Introduction to the Average True Range Indicator in Forex

An Introduction to the Average True Range Indicator in Forex

by Adam Stanley
September 10, 2021
0

What is the Average True Range indicator in forex, and what does it do? This article will serve as a...

Load More

Leave a Reply Cancel reply

Your email address will not be published. Required fields are marked *

Best Forex Automated Systems

  • TechBerry 9/10
  • Happy Galaxy 8.5/10
  • Forex Cyborg 8.5/10
  • Forex Fury 8/10
  • FXgoodway 7.5/10
  • Best Forex Brokers
  • Best Forex Robots
  • Best Forex Signals
  • Best Forex Managed Accounts

Top Trading Markets

We are dedicated to demystify the world of forex trading for you – no matter what level you are on.

Categories
  • Automated Trading
  • Crypto Robot Review
  • Cryptocurrency Trading
  • Day Trading
  • Forex Basics
  • Forex Brokers
  • Forex Education
  • Forex Forecasts
  • Forex Indicators
  • Forex Market Commentary
  • Forex Robots
  • Forex Signals
  • Forex Signals
  • Forex Tools
  • Forex Trading Strategies
  • Forex VPS
  • Fundamental Analysis
  • Managed Accounts
  • Money Management
  • News
  • Review
  • Review Platforms
  • Risk Management
  • Social Trading
  • Technical Analysis
  • Top World Traders
  • Trading Apps
  • Trading Psychology
  • Uncategorized
Tags
Acquisition AI Amazon Apple Artificial Intelligence Bitcoin bond yields CEO China earnings earnings report economy Electric Vehicles Federal Reserve financial performance Financial Results forex ea forex software reviews Growth Guidance Housing Market inflation interest rates Investing investment Investors Market Volatility merger mortgage rates net profit Nvidia Oil prices Q2 Results revenue Revenue Growth Sales sales growth Stock Futures stock market stock performance Stocks strategies technology Tesla Video
  • Terms of Use
  • Privacy Policy
  • Compensation Disclosure
  • Risk Disclosure
  • About Us
  • Contact Us

Copyright © 2023 by ForexEzy.com

No Result
View All Result
  • Top Forex Advisors
    • Best Forex Robots
    • Best Forex Signals
    • Best Managed Accounts
  • Top Forex Brokers
    • Best Forex Brokers
    • US Forex Brokers
    • UK Forex Brokers
    • MT4 Forex Brokers
    • MT5 Forex Brokers
    • Zero Spread Brokers
    • Best PayPal Brokers
    • TradingView Brokers
    • Social Trading Platforms
  • Top Review Platforms
  • Forex Education
    • Getting Started
    • Forex Basics
    • Forex Trading Strategies
    • Money Management
    • Risk Management
    • Technical Analysis
    • Fundamental Analysis
    • Trading Psychology
    • Social Trading
    • Automated Trading
  • Forex Tools
    • Forex Robots
    • Forex Indicators
    • Forex Signals
    • Forex VPS
  • Forex Forecast
  • Crypto
    • Best Crypto Exchanges
    • Best Crypto Bots
    • Crypto Guides & Forecasts

© 2023, Forexezy. {copy} {year}