Any newbie looking at forex charts will quickly notice that markets move in ‘waves’. Unfortunately, they would eventually realize that this behavior is quite chaotic. What if one could somewhat make sense of these seemingly random movements?
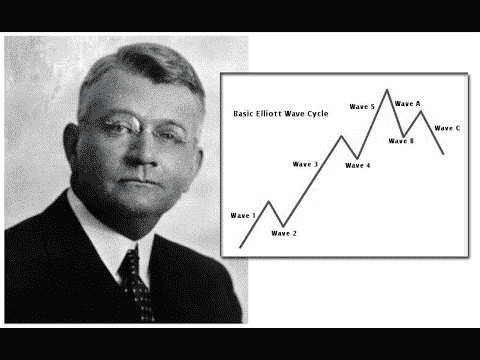
Well, an American accountant named Ralph Elliott (1871-1948) believed traders could find repeatable patterns from this manic behavior in the markets. So he proposed the Elliott Wave Theory or simply the Wave Principle.
This framework was first published in Elliott’s seminal 1938 book aptly entitled The Wave Principle from stock market analysis, worth about 75 years.
The Elliott Wave Theory is a pivotal technical analysis foundation in any financial market still practiced by thousands of traders globally. Let’s explore more on the Elliott Wave Theory and how it’s applicable in forex trading.
What is the Elliott Wave theory?
The Wave Principle essentially chronicles mass psychology and how it moves between periods of optimism and pessimism through predictable sequences.
At its core, the theory states that all markets move in a five-wave impulse and three-wave pullback across all time scales. The five-wave impulse portion consists of waves 1, 3, and 5 as motive (those moving with the trend), while waves 2 and 4 are corrective (those moving against the trend).
The larger three-wave pullback (also known as the ABC) comes after the preceding five-wave structure. The image below is a simple illustration of this wave theory for better understanding.
One interesting element of the waves is their fractal nature, which simply means they repeat themselves infinitely across all time frames. Essentially, you can break or sub-divide each wave further into smaller parts of the five-wave or ABC structure.
However, the more significant portion is identifying each wave successfully, which can take years of experience. The Elliott Wave theory merely provides a skeleton. Once traders know where they are in the structure, they can use a range of patterns to support it and find reliable trading opportunities.
For instance, if you’re a fan of triangles, you can trade this pattern (which is corrective in nature) as part of Elliott’s ABC structure after identifying the primary five-wave design.
Identifying Elliott waves
Now comes the hard part: identifying the waves themselves! Generally, it’s much easier to identify the five-wave impulse than the corrective ABC structure because a market can correct itself in multiple ways.
However, Elliott Wave experts and much of the literature around this topic have listed six frequently-appearing corrective patterns.
Being in sync with this theory means having high proficiency in using the Fibonacci tool as all the identification rules are based on retracements or extensions from Fibonacci. Let’s start with the five-wave impulsive waves.
Impulse waves
The three cardinal or golden rules for identifying these are the following:
- Wave 2 cannot pass the beginning of or retrace beyond wave 1
- Wave 3 is never the shortest impulse wave
- Similar to rule #1, wave 4 cannot pass the price territory of wave 3
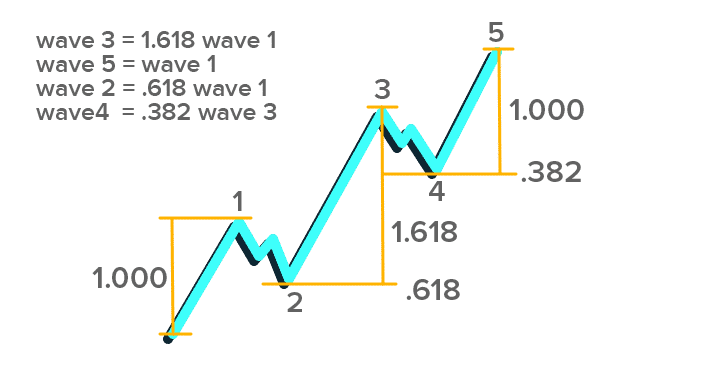
The Fibonacci ratios for the five-wave structure are as follows, with an accompanying image below for better illustration:
- Wave 2 is roughly 50%, 61.8%, or, in rare cases, 76.4% of wave 1
- Wave 3 is roughly 161.8% of wave 1
- Wave 4 is roughly 38.2%, 50% or 61.8% of wave 3
- Wave 5 is roughly 1.618% of wave 4. It can also be approximately equal to wave 1.
Corrective waves
Any die-hard Elliott Wave practitioner will tell you recognizing the ABC part of the entire theory is no child’s play. This is because a market can correct itself in an array of unique, complex structures.
As previously mentioned, most experts seem to lean on primarily six patterns, namely the zig-zag, flat, irregular, horizontal triangle, double three, and triple three (see the image below).
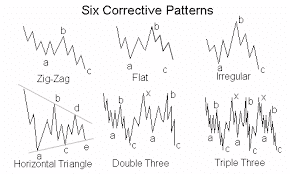
Each of these structures comes with its own Fibonacci rations, which would take ages to cover here. A dedicated resource diving into this aspect of the corrective waves can be found here.
The market psychology behind Elliott waves
Forex, like any market, goes through phases of pessimism, skepticism, optimism, and euphoria. Elliot Waves simply express each of these stages to describe market sentiment.
The pessimism and skepticism phases may be best described with waves 1 and 2. These are not the most favored waves to trade because they form from a preceding move.
At this stage, nobody truly knows whether the market is in a brand-new trend or not. Wave 3 is one of the most attractive and tends to be the deepest because it’s the truest confirmation that a new trend is indeed underway.
The fourth wave typically occurs because all the traders take profits from the third wave. This stage might also act as a good place for all those who didn’t enter wave 3 to go for one more push: wave 5.
Generally, waves 3 and 5 are the most optimistic of them all. This means that after wave 5, you can expect the market to considerably lose steam leading to the three-wave pullback.
Trading with Elliott waves in forex
Let’s now put the Wave Theory into practice. Although some platforms can automatically plot the waves for you, it’s always best to confirm manually on your chart.
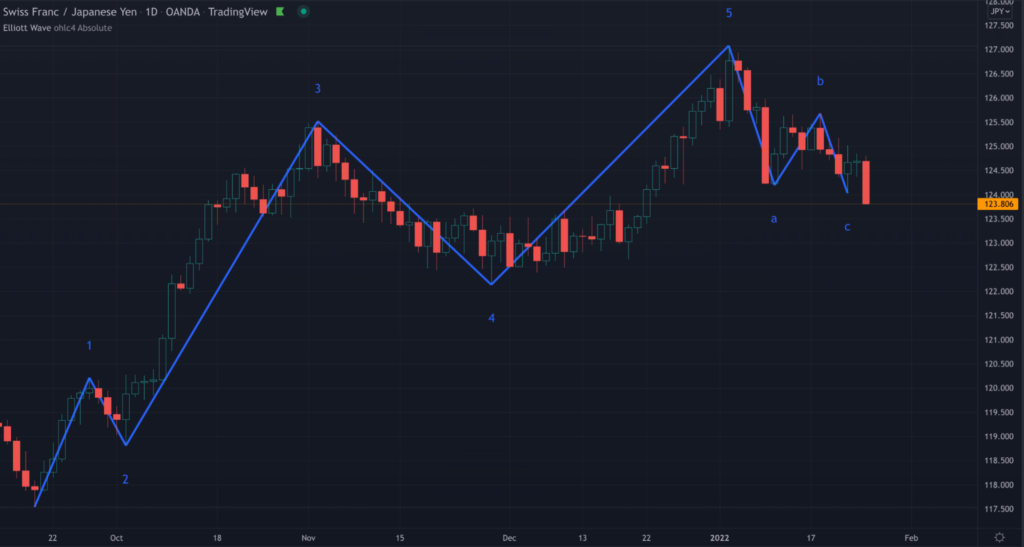
On the CHFJPY daily chart below, we’ve identified waves 1 to 4 . Let’s assume a trader was anticipating the fifth wave. We know that wave 4 is typically from 38.2% to 61.8% of wave 3.
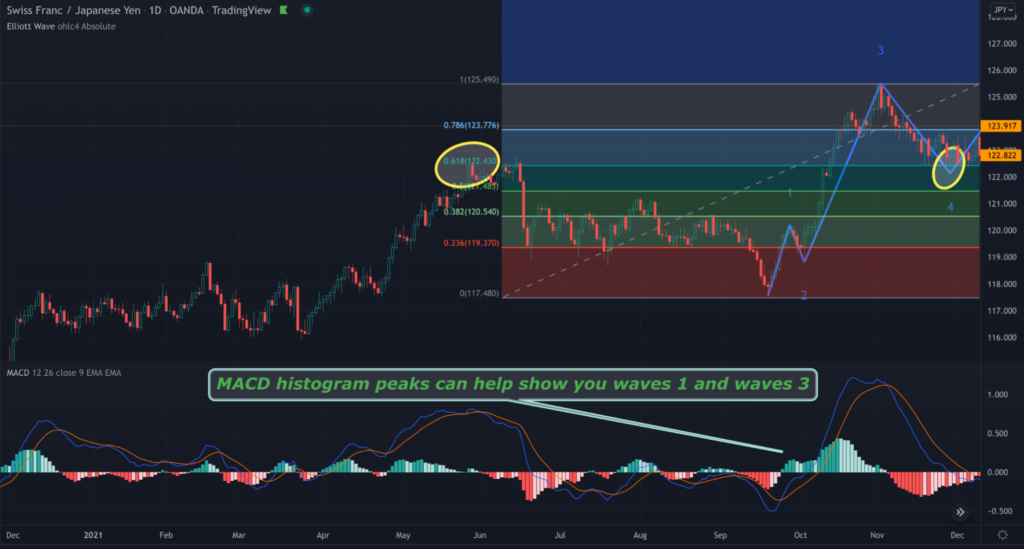
We can see the price spent several days at the 61.8% level, confirming this support level was quite strong. The theory would have helped a trader to form a solid bullish bias, along with other supporting factors.
(Hack: Traders can use the MACD as extra confirmation for waves 1 and 3. The histogram peak of wave 3 should be higher than for wave 1 since wave 3 is the strongest).
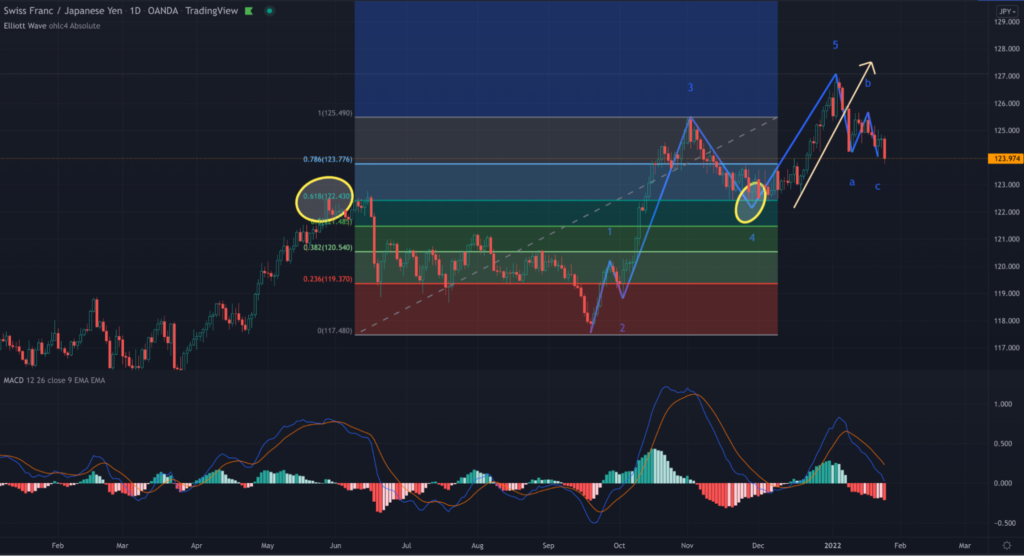
Voila! The market took off after it reached the Fib level and confirmed wave 5 in the last illustration above.
Final word
While markets are quite fractal, making predictions is no easy feat, even with an advanced method like Elliott waves.
Like any methodology, this theory is not a holy grail; it only provides a framework. It’s up to the trader to use numerous other supporting factors to fill in the blanks in anticipation of the next potential wave.


