ForexEzy
No Result
View All Result
  • Home
  • Getting Started with Forex
  • Forex Education
    • Forex Basics
    • Forex Trading Strategies
    • Money Management
    • Risk Management
    • Technical Analysis
    • Fundamental Analysis
    • Trading Psychology
    • Social Trading
    • Automated Trading
  • Forex Tools
    • Forex Robots
    • Forex Indicators
    • Forex Signals
  • Top Forex Brokers
  • Top Forex Robots
  • Commentary
  • Blog
No Result
View All Result
ForexEzy
No Result
View All Result
Home Forex Education Technical Analysis

Volume Based Indicator – On Balance Volume (OBV)

by Tim Baudin
September 8, 2016
in Technical Analysis
0
Volume Based Indicator – On Balance Volume (OBV)
0
SHARES
11
VIEWS
Share on FacebookShare on Twitter

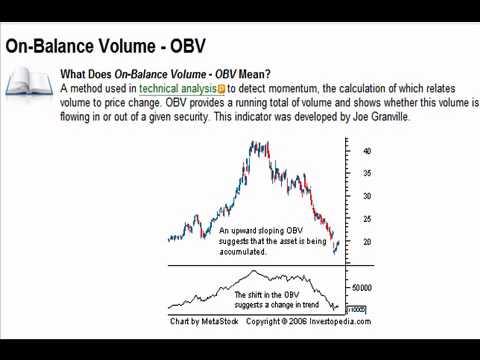
On Balance Volume or OBV is a volume based indicator that measures buying and selling pressure. This indicator focuses on the relation between volume and price. This indicator was described by Joe Granville in his book New Key to Stock Market Profits in 1963.

This indicator has the unique ability to measure the positive and negative volume flow as it compares the volume with the most recent close price to the previous close price.

Calculation:

OBV indicator represents the running total of positive and negative volume. The calculation of OBV is as follows,

If the current close price is above the previous close price,

Then Current OBV = Previous OBV + Current Volume

If the current close price is below the previous close price,

Then Current OBV = Previous OBV – Current Volume

If current close price is equal to the previous close price,

Then Current OBV = Previous OBV

Interpretation:

In the forex market,  it is hard to understand the volume as we do not have the volume of the total market. We can only see the volume traded in the specific dealer or broker while trading. OBV is quite effective to represent volume movement as its focus on the volume trend rather than volume numbers.

One of the effective ways to use OBV in trading is to trade divergences. Most of the times, regular divergence can detect trend reversals successfully. Divergence occurs when indicator direction does not match with the direction of price or indicator moves against the price.

Divergence can be bullish or bearish. In bullish regular divergence, price creates Lower Low (LL) but indicator creates Higher Low (HL). In bearish regular divergence, price creates Higher High (HH) but indicator creates Lower High (LH). OBV indicator is widely used for trading regular divergences as this indicator is a volume based indicator.

On-Balance-Volume

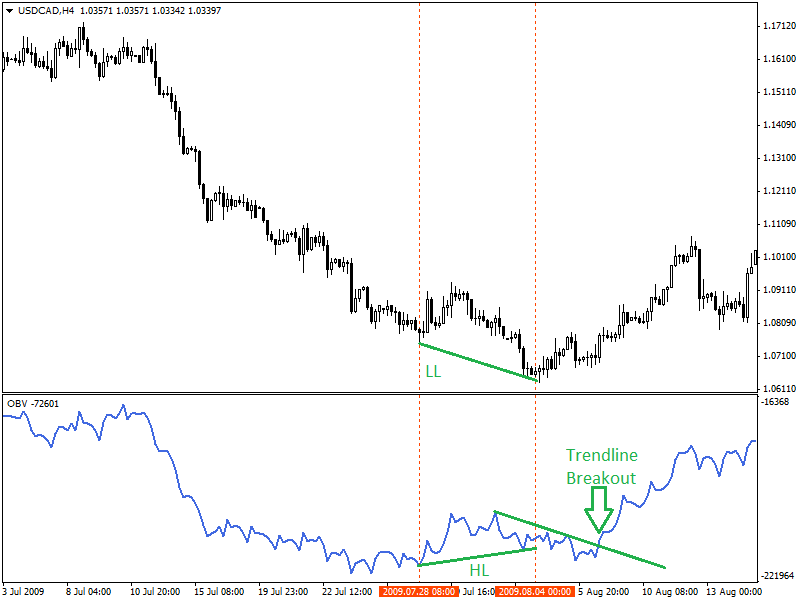
4-hour chart of USD/CAD is showing a bullish regular divergence which indicating the possibility of the bullish trend reversal. Here, a price is showing weakness by creating Lower Low (LL) while the indicator is showing strength by creating a Higher Low (HL).

After identifying the bullish regular divergence, trend line breakout of OBV indicator can be used as final confirmation for a buy signal.

4-hour-chart-of-USDCAD

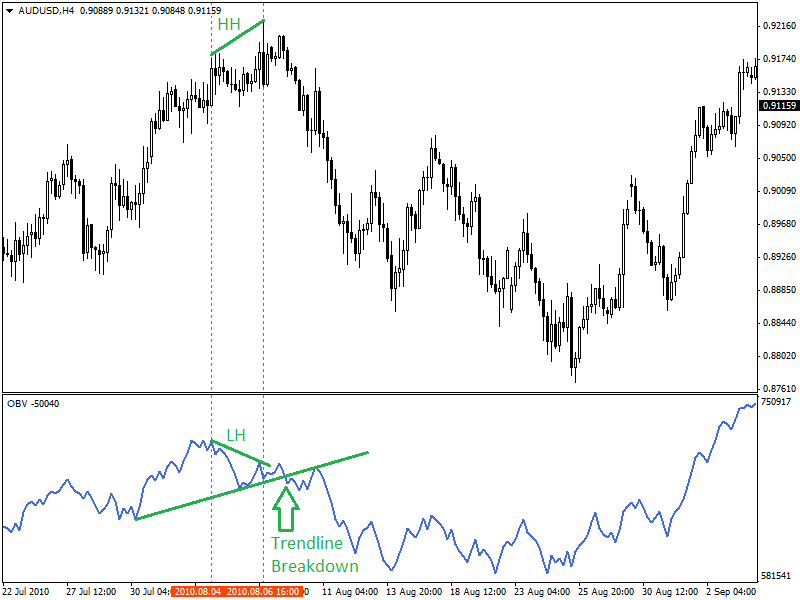
4-hour chart of AUD/USD is showing bearish regular divergence as price created Higher High (HH), but the indicator is showing weakness by creating Lower High (LH). Trend line breakdown can be used as a final confirmation after identifying the bearish regular divergence as shown in the chart above.

OBV can confirm the direction of the trend. Increasing OBV with increasing price is a sign of strong buying pressure and bullish trend. Inversely, decreasing OBV is a sign of weakness, selling pressure and bearish trend.

Summary:

OBV indicator is mostly used as an additional indicator to confirm trend direction, price momentum, and buying/selling pressure. However, OBV alone is also useful in case of divergence trading.

ShareTweet
Previous Post

Trend Indicator – Average Directional Index (ADX)

Next Post

Using Gann Fan Indicator in Trading

Related Posts

An Introduction To Forex Momentum Indicators

An Introduction To Forex Momentum Indicators

by Tim Baudin
January 19, 2021
0

Overview There is a recurring belief in trading communities that price lies, but momentum doesn’t. The forex market is somewhat...

An Introduction To Forex Indicators

An Introduction To Forex Indicators

by Chintan Patel
January 1, 2021
0

What are the Forex indicators? A vast part of technical analysis is understanding and trading with these tools. Although they...

Using Trendlines and Saucer Formations in Trading

Using Trendlines and Saucer Formations in Trading

by Tim Baudin
December 21, 2020
0

Trendlines are those lines that you can recognize easily. A trader draws trendlines on charts in order to connect a...

RSI - Top 3 Real Charts You've Missed

RSI – Top 3 Real Charts You’ve Missed

by Tim Baudin
December 17, 2020
0

Overview Are you still doubting the power of the RSI? This article will cover three recent forex trading opportunities mostly...

The Trading Indicator You Have not Heard of – The Williams %R

The Trading Indicator You Have not Heard of – The Williams %R

by Adam Stanley
December 1, 2020
0

The Williams Percentage Range is a highly effective tool that measures price variations over a period of time for various...

Load More

Best Forex EA

  • ROFX 9/10
  • Forex Fury 8/10
  • FXgoodway 7.5/10
  • Z Trader FX EA 7/10
  • Forex Incontrol Reborn 6.5/10

Popular News

  • The Best RSI and CCI Combination Trading Strategy for Optimum Returns

    The Best RSI and CCI Combination Trading Strategy for Optimum Returns

    2 shares
    Share 2 Tweet 0
  • Rofx Review – High Profitability and Stable Performance Analysis

    29 shares
    Share 29 Tweet 0
  • The Best Forex Scalping Strategy – Using 3 Popular Technical Indicators

    0 shares
    Share 0 Tweet 0
  • The Best MT4 Indicators & Expert Advisors For Forex Trading

    2 shares
    Share 2 Tweet 0
  • How to check if the indicator is repainting?

    2 shares
    Share 2 Tweet 0

Trading

Footer

We are dedicated to demystify the world of forex trading for you – no matter what level you are on.

Categories
  • Automated Trading
  • Day Trading
  • Forex Basics
  • Forex Brokers
  • Forex Education
  • Forex Forecasts
  • Forex Indicators
  • Forex Market Commentary
  • Forex Robots
  • Forex Signals
  • Forex Tools
  • Forex Trading Strategies
  • Fundamental Analysis
  • Money Management
  • News
  • Risk Management
  • Social Trading
  • Technical Analysis
  • Top World Traders
  • Trading Psychology
  • Uncategorized
Tags
arbitrage atr bollinger bands cci chart patterns classics copy trading courses day trading forex brokers forex charts forex ea forex education forex forecasting Forex Indicators forex software reviews grid trading hedging ichimoku macd market cycles news trading oscillators price action trading rsi social trading strategies tips & tricks trading bots trading platforms trend trading Video
  • Terms of Use
  • Privacy Policy
  • Compensation Disclosure
  • Risk Disclosure
  • About Us
  • Contact Us

Copyright © 2020 by ForexEzy.com

No Result
View All Result
  • Home
  • Getting Started with Forex
  • Forex Education
    • Forex Basics
    • Forex Trading Strategies
    • Money Management
    • Risk Management
    • Technical Analysis
    • Fundamental Analysis
    • Trading Psychology
    • Social Trading
    • Automated Trading
  • Forex Tools
    • Forex Robots
    • Forex Indicators
    • Forex Signals
  • Top Forex Brokers
  • Top Forex Robots
  • Commentary
  • Blog

© 2020, Forexezy.