ForexEzy
No Result
View All Result
  • Home
  • Getting Started with Forex
  • Forex Education
    • Forex Basics
    • Forex Trading Strategies
    • Money Management
    • Risk Management
    • Technical Analysis
    • Fundamental Analysis
    • Trading Psychology
    • Social Trading
    • Automated Trading
  • Forex Tools
    • Forex Robots
    • Forex Indicators
    • Forex Signals
  • Top Forex Brokers
  • Top Forex Robots
  • Commentary
  • Blog
No Result
View All Result
ForexEzy
No Result
View All Result
Home Forex Education Technical Analysis

Trend Indicator – Average Directional Index (ADX)

by Tim Baudin
September 8, 2016
in Technical Analysis
0
Trend Indicator – Average Directional Index (ADX)
0
SHARES
11
VIEWS
Share on FacebookShare on Twitter

Average Directional Index (ADX) is a unique trend indicator. This indicator can measure the trend strength besides trend direction. In 1978, Wilder described ADX in his book named “New Concepts in Technical Trading Systems”.

https://youtu.be/Csq7gDnbapI

ADX indicator consists three different lines; ADX line, +DI Line and –DI Line.

ADX line is used to measure trend strength and the rest of the lines are used to determine trend direction. Here is an example chart of ADX given below,

Average-Directional-Index-ADX

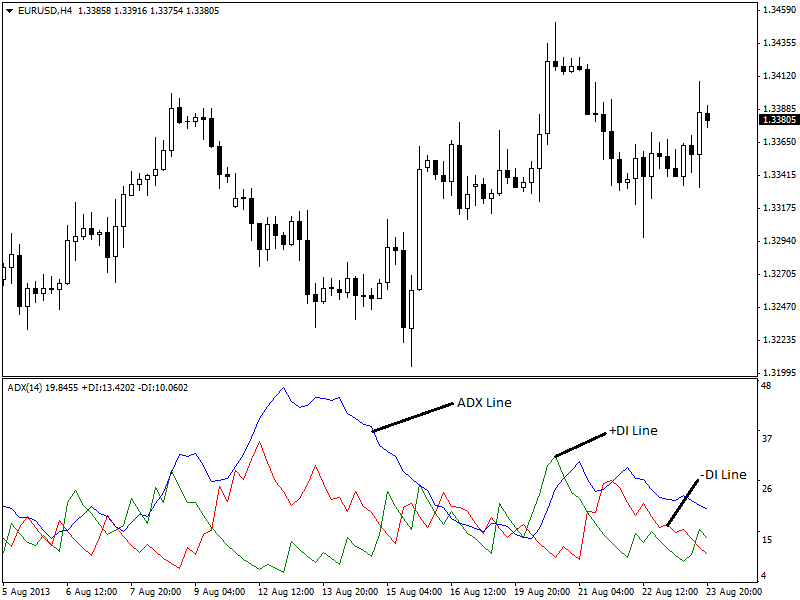
4hour chart of EUR/USD is showing ADX indicator.

Calculation:

Welles Wilder developed ADX indicator by combining two indicators. One of these two indicators is positive directional indicator or +DI and another one are a negative directional indicator or –DI. At first, +DI and –DI are calculated,

Up Move = Today’s High Price – Yesterdays High Price

Down Move = Yesterday’s Low Price – Today’s Low Price

If Up Move > Down Move and Up Move > 0, then +DM = Up Move, otherwise +DM = 0

If Down Move > Up Move and Down move > 0, then –DM = Down Move, otherwise –DM = 0

Now,

+DI = 100 times exponential moving average of +DM / Average True Range

-DI = 100 times exponential moving average of –DM / Average True Range

ADX = 100 times exponential moving average of the absolute value of (+DI – -DI)/(+DI + -DI)

Some traders use different types of moving average for the variation such as weighted moving averages instead of exponential moving averages.

Interpretation:

ADX indicator can be used in many ways. These are described below,

Trend Strength:

The main feature of ADX indicator is that it can measure trend strength which many other indicators can not measure. ADX line value can identify trending and ranging conditions. If ADX Line value is above 25 then the trend is strong. If ADX Line value is below 25, then the trend is weak or in ranging situation. Increasing ADX line also indicates that the trend is strong.

Here is an example is given below,

trending-and-ranging-situations

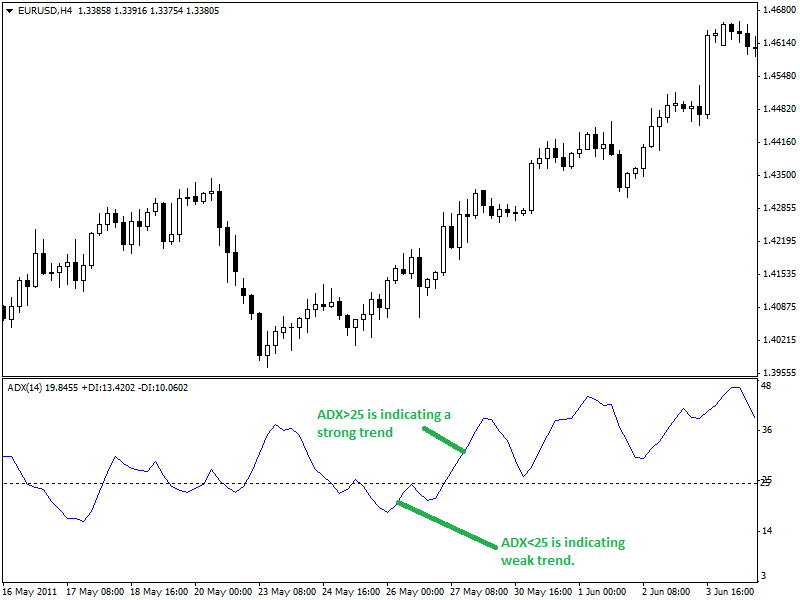
4-hour chart of EUR/USD is showing trending and ranging situations.

Trend Direction:

ADX line can not identify trend direction. To determine trend direction you have to look at +DI and –DI lines. If +DI line is above –DI line then the trend is considered as an uptrend. Inversely, if the -DI line is above +DI line, then the trend is considered as a downtrend.

Here is an example is given in the chart below.

Trend-Direction

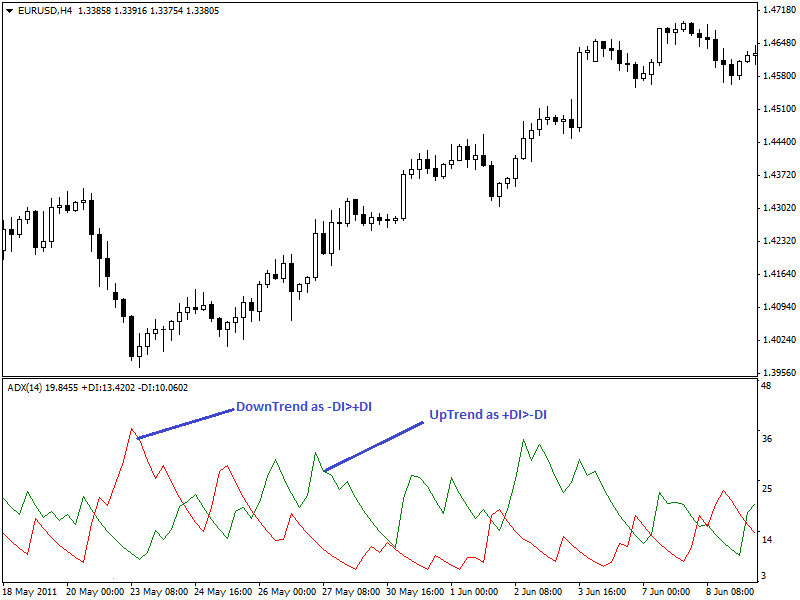
4-hour chart of EUR/USD is showing uptrend and downtrend. The uptrend has confirmed as +DI>-DI. The downtrend has confirmed as –DI>+DI.

Trading Signals:

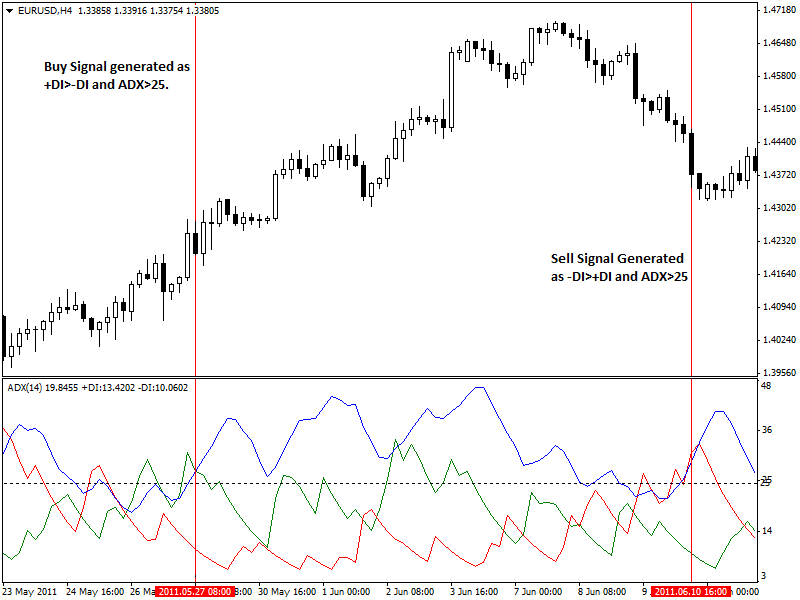
The best way to use ADX is to use both ADX line and +DI and –DI crossovers. A buy signal generated as soon as ADX line crosses above 25 and +DI is above –DI in that time. This buy signal is an entry signal for the long position. Inversely, a sell signal generated as ADX crosses above 25 while –DI is above +DI line.

This sell signal is an entry signal for the short position. Here is an example showing buy and sell signals in the 4-hour chart of EUR/USD (given below).

Trading-Signals

Summary:

ADX is an important indicator in trading and technical analysis as it can determine trend strength and weakness besides trend direction. This unique feature of this indicator made it popular to traders. Most traders use this indicator with other indicators.

However, ADX is more suitable for mid to long term trading methods or strategies.

ShareTweet
Previous Post

Trading the Rate of Change (ROC) Indicator

Next Post

Volume Based Indicator – On Balance Volume (OBV)

Related Posts

An Introduction To Forex Indicators

An Introduction To Forex Indicators

by Chintan Patel
January 1, 2021
0

What are the Forex indicators? A vast part of technical analysis is understanding and trading with these tools. Although they...

Using Trendlines and Saucer Formations in Trading

Using Trendlines and Saucer Formations in Trading

by Tim Baudin
December 21, 2020
0

Trendlines are those lines that you can recognize easily. A trader draws trendlines on charts in order to connect a...

RSI - Top 3 Real Charts You've Missed

RSI – Top 3 Real Charts You’ve Missed

by Tim Baudin
December 17, 2020
0

Overview Are you still doubting the power of the RSI? This article will cover three recent forex trading opportunities mostly...

The Trading Indicator You Have not Heard of – The Williams %R

The Trading Indicator You Have not Heard of – The Williams %R

by Adam Stanley
December 1, 2020
0

The Williams Percentage Range is a highly effective tool that measures price variations over a period of time for various...

How to Use Technical Analysis in the Market?

How To Use Technical Analysis In The Market?

by Adam Stanley
November 25, 2020
0

If you are trading in the market, you’ll know that uncertainty and risk lurk at every step. In such a...

Load More

Best Forex EA

  • ROFX 9/10
  • Forex Fury 8/10
  • FXgoodway 7.5/10
  • Z Trader FX EA 7/10
  • Forex Incontrol Reborn 6.5/10

Popular News

  • The Best RSI and CCI Combination Trading Strategy for Optimum Returns

    The Best RSI and CCI Combination Trading Strategy for Optimum Returns

    2 shares
    Share 2 Tweet 0
  • Rofx Review – High Profitability and Stable Performance Analysis

    29 shares
    Share 29 Tweet 0
  • The Best Forex Scalping Strategy – Using 3 Popular Technical Indicators

    0 shares
    Share 0 Tweet 0
  • The Best MT4 Indicators & Expert Advisors For Forex Trading

    2 shares
    Share 2 Tweet 0
  • How to check if the indicator is repainting?

    2 shares
    Share 2 Tweet 0

Trading

Footer

We are dedicated to demystify the world of forex trading for you – no matter what level you are on.

Categories
  • Automated Trading
  • Day Trading
  • Forex Basics
  • Forex Brokers
  • Forex Education
  • Forex Forecasts
  • Forex Indicators
  • Forex Market Commentary
  • Forex Robots
  • Forex Signals
  • Forex Tools
  • Forex Trading Strategies
  • Fundamental Analysis
  • Money Management
  • News
  • Risk Management
  • Social Trading
  • Technical Analysis
  • Top World Traders
  • Trading Psychology
  • Uncategorized
Tags
arbitrage atr bollinger bands cci chart patterns classics copy trading courses day trading forex brokers forex charts forex ea forex education forex forecasting Forex Indicators forex software reviews grid trading hedging ichimoku macd market cycles news trading oscillators price action trading rsi social trading strategies tips & tricks trading bots trading platforms trend trading Video
  • Terms of Use
  • Privacy Policy
  • Compensation Disclosure
  • Risk Disclosure
  • About Us
  • Contact Us

Copyright © 2020 by ForexEzy.com

No Result
View All Result
  • Home
  • Getting Started with Forex
  • Forex Education
    • Forex Basics
    • Forex Trading Strategies
    • Money Management
    • Risk Management
    • Technical Analysis
    • Fundamental Analysis
    • Trading Psychology
    • Social Trading
    • Automated Trading
  • Forex Tools
    • Forex Robots
    • Forex Indicators
    • Forex Signals
  • Top Forex Brokers
  • Top Forex Robots
  • Commentary
  • Blog

© 2020, Forexezy.