ForexEzy
No Result
View All Result
  • Home
  • Getting Started with Forex
  • Forex Education
    • Forex Basics
    • Forex Trading Strategies
    • Money Management
    • Risk Management
    • Technical Analysis
    • Fundamental Analysis
    • Trading Psychology
    • Social Trading
    • Automated Trading
  • Forex Tools
    • Forex Robots
    • Forex Indicators
    • Forex Signals
  • Top Forex Brokers
  • Top Forex Robots
  • Commentary
  • Blog
No Result
View All Result
ForexEzy
No Result
View All Result
Home Forex Education Technical Analysis

Trading the Rate of Change (ROC) Indicator

by Tim Baudin
September 8, 2016
in Technical Analysis
0
Trading the Rate of Change (ROC) Indicator
0
SHARES
11
VIEWS
Share on FacebookShare on Twitter

The Rate Of Change (ROC) is a momentum indicator that measures the price change percentage of a specific number of look back periods. ROC simply compares the current price with the price of n number of periods ago.

It is a popular technical indicator that is used mostly for short term trading approaches.

Calculation:

The calculation of ROC indicator has given below,

Rate Of Change (ROC) = {(Current Close – Close n periods ago) / (Close n periods ago)} x 100

The default period of this indicator is 14, but many traders use different periods such as 12, 26, 52 etc.

Interpretation:

Most momentum indicators or oscillators are unable to identify trend direction, but ROC can detect trend direction. This indicator can identify trend direction and short term momentum changes of the price at a time. This is why some experienced traders use this indicator individually.

The mechanism and valuation of this indicator are quite different in forex market rather than the stock market. Thus, one should be careful about the values and levels of this indicator while using for forex trading. In the forex market, the extreme value is +1 and -1 while middle line or equilibrium is at 0. A trend can be identified as soon as any pair hit any of these two extreme values.

For example, if ROC of a pair moves above +1 then it is considered that the uptrend has started. On the other hand, downtrend starts as soon as ROC moves below -1. After identifying the trend direction, traders should wait for buy or sell signals. The equilibrium line or 0 line crossovers should be taken as final buy and sell signals after identifying the major trend. Buy signal generates as ROC crosses above 0 line and sell signal generate as ROC crosses below 0 line.

Rate-Of-Change-ROC-Indicator

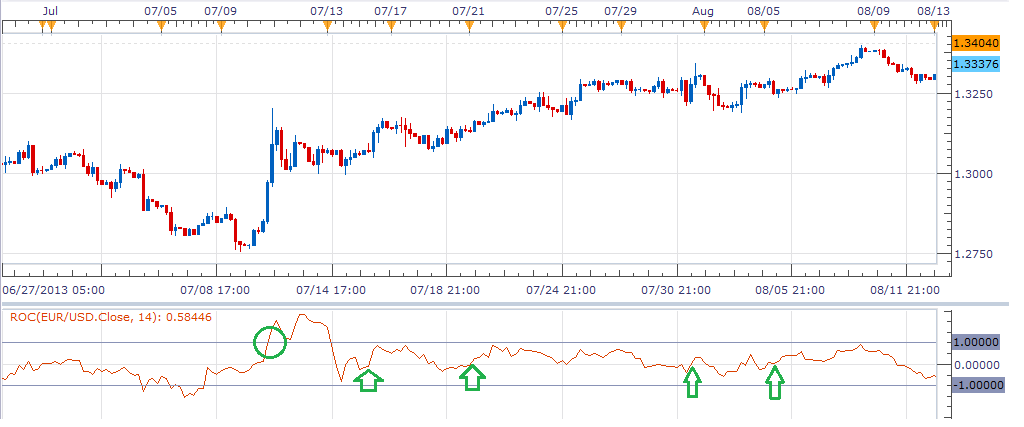
4-hour chart of EUR/USD (given above) is showing buy signals or entry signals for long positions. The uptrend has confirmed as soon as ROC moved above +1 (marked as the green circle). In the uptrend, buy signals occurred as ROC crossed above 0 line. Buy signals or entry signals for long positions are marked as green colored up arrows.

4-hour-chart-of-EURUSD

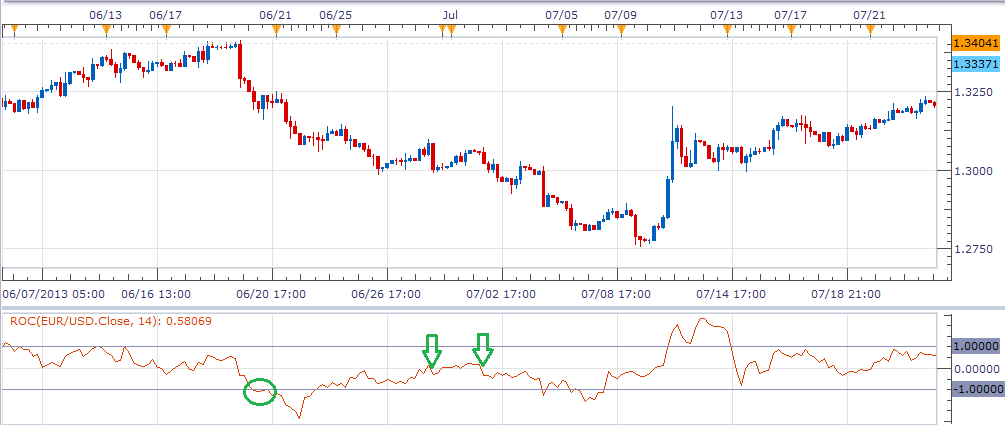
4-hour chart of EUR/USD (given above) is showing sell signals or entry signals for short positions. The downtrend has confirmed as soon as ROC crossed below -1 (marked as a green colored circle). In the downtrend, sell signals or entry signals for short positions occurred as soon as ROC crossed below 0 line from above. Entry signals have marked as green colored down arrows. 

Summary:

ROC can be combined with other indicators and often carry better results. ROC can be combined with RSI, MACD, Moving Averages or Trend Lines. Many traders use different ROC of various periods at a time. This is also an effective technique of using ROC.

ShareTweet
Previous Post

Parabolic SAR Indicator – Trend Indicator

Next Post

Trend Indicator – Average Directional Index (ADX)

Related Posts

An Introduction To Forex Momentum Indicators

An Introduction To Forex Momentum Indicators

by Tim Baudin
January 19, 2021
0

Overview There is a recurring belief in trading communities that price lies, but momentum doesn’t. The forex market is somewhat...

An Introduction To Forex Indicators

An Introduction To Forex Indicators

by Chintan Patel
January 1, 2021
0

What are the Forex indicators? A vast part of technical analysis is understanding and trading with these tools. Although they...

Using Trendlines and Saucer Formations in Trading

Using Trendlines and Saucer Formations in Trading

by Tim Baudin
December 21, 2020
0

Trendlines are those lines that you can recognize easily. A trader draws trendlines on charts in order to connect a...

RSI - Top 3 Real Charts You've Missed

RSI – Top 3 Real Charts You’ve Missed

by Tim Baudin
December 17, 2020
0

Overview Are you still doubting the power of the RSI? This article will cover three recent forex trading opportunities mostly...

The Trading Indicator You Have not Heard of – The Williams %R

The Trading Indicator You Have not Heard of – The Williams %R

by Adam Stanley
December 1, 2020
0

The Williams Percentage Range is a highly effective tool that measures price variations over a period of time for various...

Load More

Best Forex EA

  • ROFX 9/10
  • Forex Fury 8/10
  • FXgoodway 7.5/10
  • Z Trader FX EA 7/10
  • Forex Incontrol Reborn 6.5/10

Popular News

  • The Best RSI and CCI Combination Trading Strategy for Optimum Returns

    The Best RSI and CCI Combination Trading Strategy for Optimum Returns

    2 shares
    Share 2 Tweet 0
  • Rofx Review – High Profitability and Stable Performance Analysis

    29 shares
    Share 29 Tweet 0
  • The Best Forex Scalping Strategy – Using 3 Popular Technical Indicators

    0 shares
    Share 0 Tweet 0
  • The Best MT4 Indicators & Expert Advisors For Forex Trading

    2 shares
    Share 2 Tweet 0
  • How to check if the indicator is repainting?

    2 shares
    Share 2 Tweet 0

Trading

Footer

We are dedicated to demystify the world of forex trading for you – no matter what level you are on.

Categories
  • Automated Trading
  • Day Trading
  • Forex Basics
  • Forex Brokers
  • Forex Education
  • Forex Forecasts
  • Forex Indicators
  • Forex Market Commentary
  • Forex Robots
  • Forex Signals
  • Forex Tools
  • Forex Trading Strategies
  • Fundamental Analysis
  • Money Management
  • News
  • Risk Management
  • Social Trading
  • Technical Analysis
  • Top World Traders
  • Trading Psychology
  • Uncategorized
Tags
arbitrage atr bollinger bands cci chart patterns classics copy trading courses day trading forex brokers forex charts forex ea forex education forex forecasting Forex Indicators forex software reviews grid trading hedging ichimoku macd market cycles news trading oscillators price action trading rsi social trading strategies tips & tricks trading bots trading platforms trend trading Video
  • Terms of Use
  • Privacy Policy
  • Compensation Disclosure
  • Risk Disclosure
  • About Us
  • Contact Us

Copyright © 2020 by ForexEzy.com

No Result
View All Result
  • Home
  • Getting Started with Forex
  • Forex Education
    • Forex Basics
    • Forex Trading Strategies
    • Money Management
    • Risk Management
    • Technical Analysis
    • Fundamental Analysis
    • Trading Psychology
    • Social Trading
    • Automated Trading
  • Forex Tools
    • Forex Robots
    • Forex Indicators
    • Forex Signals
  • Top Forex Brokers
  • Top Forex Robots
  • Commentary
  • Blog

© 2020, Forexezy.