ForexEzy
No Result
View All Result
  • Home
  • Getting Started with Forex
  • Forex Education
    • Forex Basics
    • Forex Trading Strategies
    • Money Management
    • Risk Management
    • Technical Analysis
    • Fundamental Analysis
    • Trading Psychology
    • Social Trading
    • Automated Trading
  • Forex Tools
    • Forex Robots
    • Forex Indicators
    • Forex Signals
  • Top Forex Brokers
  • Top Forex Robots
  • Commentary
  • Blog
No Result
View All Result
ForexEzy
No Result
View All Result
Home Forex Education Technical Analysis

Using Gann Fan Indicator in Trading

by Tim Baudin
September 8, 2016
in Technical Analysis
0
Factors To Consider For Beginner Traders
0
SHARES
11
VIEWS
Share on FacebookShare on Twitter

Gann Fan is a popular trading tool. It is basically a drawing tool developed by a financial genius William Delbert Gann. This incredible trading tool has used by traders for decades. The most well-known indicator or tool introduced by Gann is Gann Fan.

Gann Fan is basically a series of angles which has drawn from a pivot high or pivot low point. The prime angle of Gann Fan is 1×1 which is essentially a 45-degree angle while in an uptrend and 315-degree angle while in a downtrend. Rests of the angles are 1×2, 1×3, 1×4, 1×8, 2×1, 3×1, 4×1 and 8×1.

Trading Methods:

Gann Fan indicator can be used in two ways. It can be used for trend following and trend reversal trading. Gann Fan indicator functions like trend lines but this indicator can predict the possible trend line or retracement or reversal points.

Trend Continuation:

Like trend lines, Gann Fan indicator works as support and resistance lines depending on the trend direction. In an uptrend, Gann Fan is used to determine possible support areas and pullback zones. Trend lines require two low points in an uptrend, but Gann Fan can be drawn by taking one high and one low point.

It does not require two high points like trend lines. Thus, traders can enter into a trade earlier.

Trend-Continuation-1

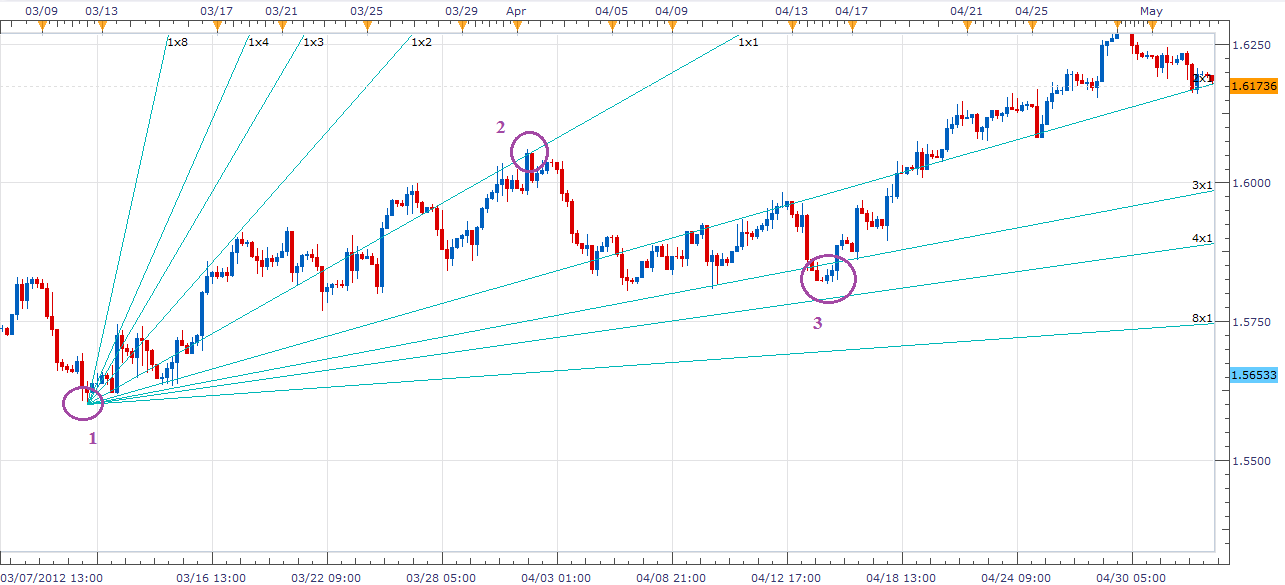
4-hour chart of GBP/USD is showing Gann Fan indicator in an uptrend. The 1×1 line of Gann Fan has drawn by connecting one low point (1) and one high point (2). 2×1 and 3×1 are considered as possible support and reversal point. This pair has got support from a 3×1 line of Gann Fan and bounced back to the prevailing uptrend.

Trend-Continuation-2

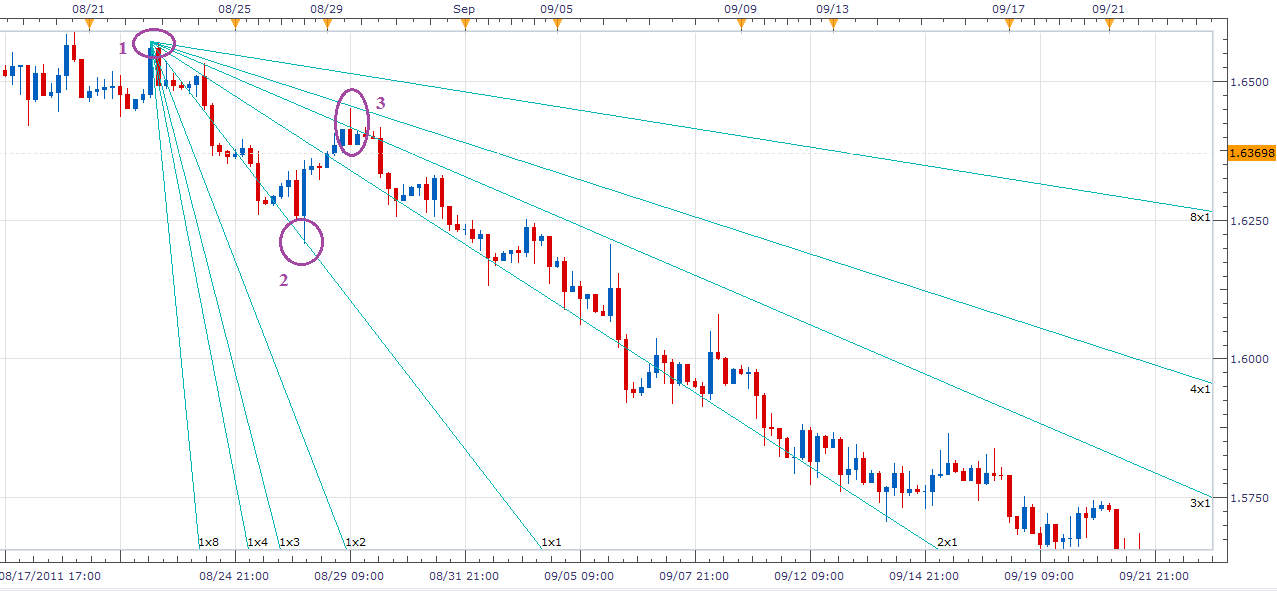
4-hour chart of GBP/USD is showing another example of Gann Fan trend following trading method in a downtrend. The 1×1 line has drawn by taking 1 and 2 points, point 3 is showing a pullback from the resistance (3×1 line of Gann Fan).

The currency pair has continued its prior downtrend after getting resistance from a 3×1 line.

Trend Reversal:

Gann Fan can be used to trade trend reversals. This method is similar to trend line breakouts. A down trend line breakout confirms a bullish reversal.

As Gann Fan lines are similar to trend lines, the breakout of these lines can be used as trend reversal signals.

Trend-Reversal-1

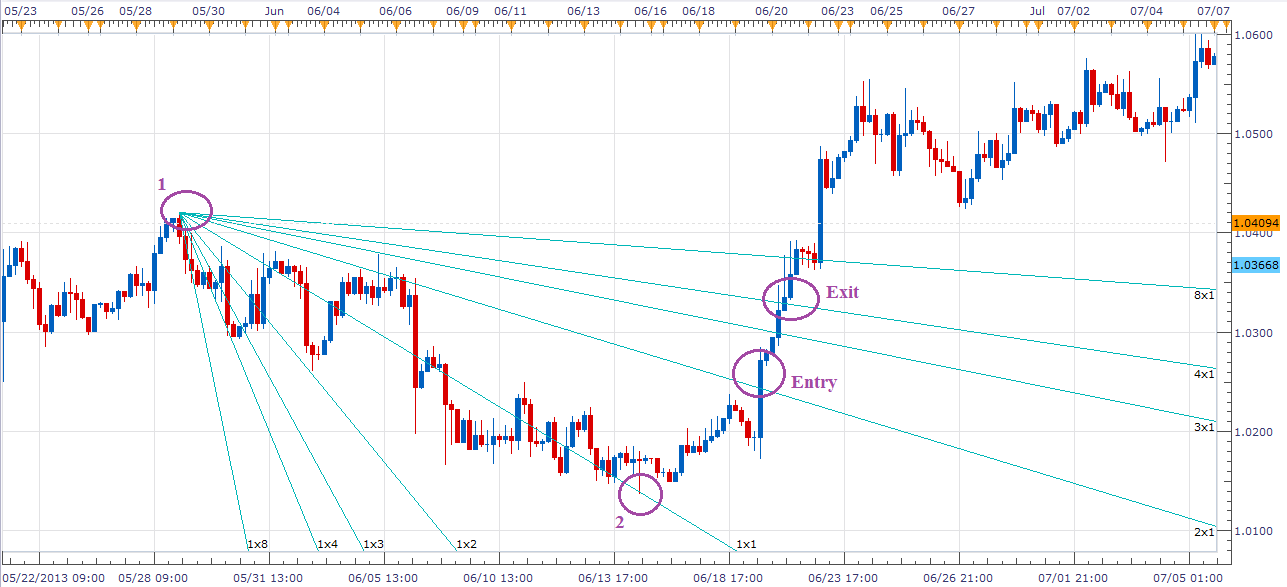
4-hour chart of USD/CAD is showing a bullish trend reversal. Gann Fan has drawn by connecting point 1 and point 2. Entry signal for long position generated as soon as candle breaks out 2×1 line.

Exit signal should be taken when candlestick touches or hits the 4×1 or 8×1 line.

Trend-Reversal-2

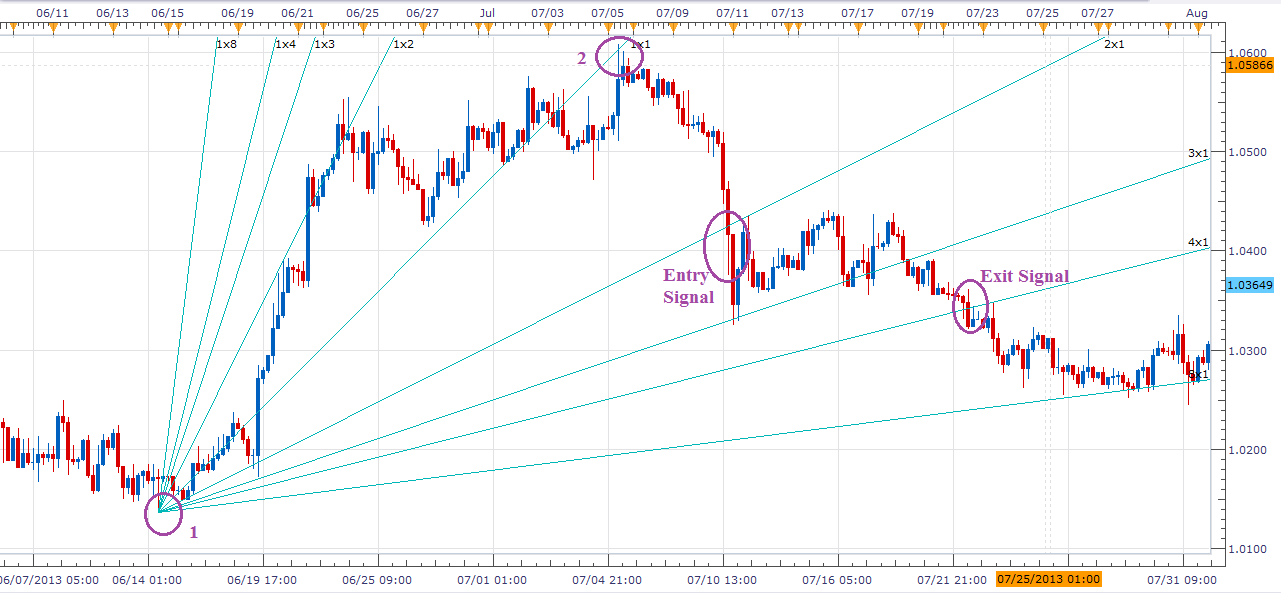
4-hour chart of USD/CAD is showing breakout, entry and exit signal for a short position. The 1×1 line has drawn by taking point 1 and point 2. Traders enter into a short position as soon as candlesticks break down the 2×1 line.

An exit signal should be taken as soon as candle hits the 4×1 line.

Summary:

This indicator or drawing tool can be combined effectively with many other indicators such as Fibonacci retracements, trend lines etc.

It is crucial to identify swing high and low points to draw Gann Fan properly.

ShareTweet
Previous Post

Volume Based Indicator – On Balance Volume (OBV)

Next Post

Types of Japanese Candlestick Patterns

Related Posts

An Introduction To Forex Momentum Indicators

An Introduction To Forex Momentum Indicators

by Tim Baudin
January 19, 2021
0

Overview There is a recurring belief in trading communities that price lies, but momentum doesn’t. The forex market is somewhat...

An Introduction To Forex Indicators

An Introduction To Forex Indicators

by Chintan Patel
January 1, 2021
0

What are the Forex indicators? A vast part of technical analysis is understanding and trading with these tools. Although they...

Using Trendlines and Saucer Formations in Trading

Using Trendlines and Saucer Formations in Trading

by Tim Baudin
December 21, 2020
0

Trendlines are those lines that you can recognize easily. A trader draws trendlines on charts in order to connect a...

RSI - Top 3 Real Charts You've Missed

RSI – Top 3 Real Charts You’ve Missed

by Tim Baudin
December 17, 2020
0

Overview Are you still doubting the power of the RSI? This article will cover three recent forex trading opportunities mostly...

The Trading Indicator You Have not Heard of – The Williams %R

The Trading Indicator You Have not Heard of – The Williams %R

by Adam Stanley
December 1, 2020
0

The Williams Percentage Range is a highly effective tool that measures price variations over a period of time for various...

Load More

Best Forex EA

  • ROFX 9/10
  • Forex Fury 8/10
  • FXgoodway 7.5/10
  • Z Trader FX EA 7/10
  • Forex Incontrol Reborn 6.5/10

Popular News

  • The Best RSI and CCI Combination Trading Strategy for Optimum Returns

    The Best RSI and CCI Combination Trading Strategy for Optimum Returns

    2 shares
    Share 2 Tweet 0
  • Rofx Review – High Profitability and Stable Performance Analysis

    29 shares
    Share 29 Tweet 0
  • The Best Forex Scalping Strategy – Using 3 Popular Technical Indicators

    0 shares
    Share 0 Tweet 0
  • The Best MT4 Indicators & Expert Advisors For Forex Trading

    2 shares
    Share 2 Tweet 0
  • How to check if the indicator is repainting?

    2 shares
    Share 2 Tweet 0

Trading

Footer

We are dedicated to demystify the world of forex trading for you – no matter what level you are on.

Categories
  • Automated Trading
  • Day Trading
  • Forex Basics
  • Forex Brokers
  • Forex Education
  • Forex Forecasts
  • Forex Indicators
  • Forex Market Commentary
  • Forex Robots
  • Forex Signals
  • Forex Tools
  • Forex Trading Strategies
  • Fundamental Analysis
  • Money Management
  • News
  • Risk Management
  • Social Trading
  • Technical Analysis
  • Top World Traders
  • Trading Psychology
  • Uncategorized
Tags
arbitrage atr bollinger bands cci chart patterns classics copy trading courses day trading forex brokers forex charts forex ea forex education forex forecasting Forex Indicators forex software reviews grid trading hedging ichimoku macd market cycles news trading oscillators price action trading rsi social trading strategies tips & tricks trading bots trading platforms trend trading Video
  • Terms of Use
  • Privacy Policy
  • Compensation Disclosure
  • Risk Disclosure
  • About Us
  • Contact Us

Copyright © 2020 by ForexEzy.com

No Result
View All Result
  • Home
  • Getting Started with Forex
  • Forex Education
    • Forex Basics
    • Forex Trading Strategies
    • Money Management
    • Risk Management
    • Technical Analysis
    • Fundamental Analysis
    • Trading Psychology
    • Social Trading
    • Automated Trading
  • Forex Tools
    • Forex Robots
    • Forex Indicators
    • Forex Signals
  • Top Forex Brokers
  • Top Forex Robots
  • Commentary
  • Blog

© 2020, Forexezy.