Japanese candlesticks are widely used in the technical analysis world. This is a vital part of charting introduced by Steve Nison. Steve Nison learned this charting technique from a Japanese broker and then he researched on it. In the 90’s, this charting technique becomes very popular in the trading world.
Japanese candlesticks are developed with 4 price data derived from the market. These data are the open, high, low and close price.
Construction of Candlesticks:
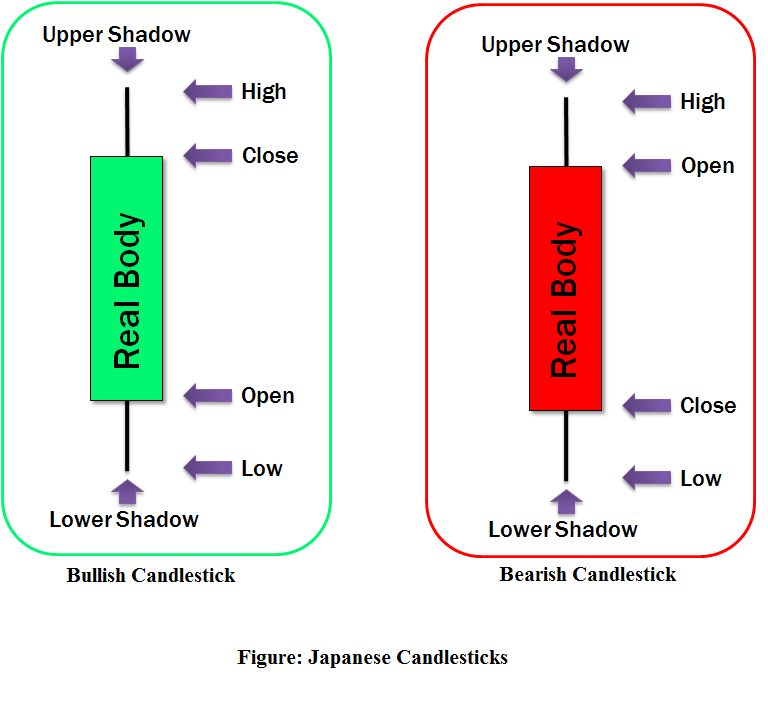
Candlesticks have two parts in their construction; one is the real body and another is shadow or leg. Each candlestick has a real body and shadow. The real body is constructed by open and close price, and shadow is constructed by high and low price. There is no difference in the shadow between bullish and bearish candlesticks.
The real body of the bullish and bearish candle has the difference. In the case of the bullish candlestick, close price is higher than the open price. Inversely, close price is lower than the open price in bearish candlestick.
The highest point of the upper shadow is developed by the high price, and the lowest point of the lower shadow is developed by the low price data. The figure (given below) shows the construction of bullish and bearish candlesticks.
Candlestick Patterns:
There are many candlestick patterns; among them, some patterns are most effective and widely used in technical analysis. Here we will discuss these key candlestick patterns. Japanese candlestick patterns can be classified as bullish, bearish and neutral patterns according to their indication.
Bullish Candlestick Patterns:
Bullish candlestick patterns indicate the possibility of bullishness. The most effective and used bullish candlesticks are described below.
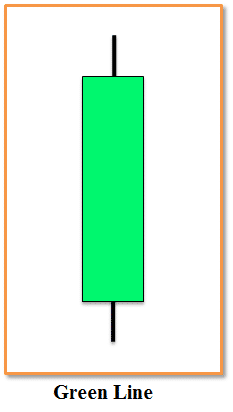
Green Line:
This is a strong bullish candle, normally found frequently in a bullish market condition. This pattern consists of one candlestick only. It formed as a long bullish candle when the open price is near the near the low price and close price is near the high price. This pattern is also known as a long white candle.
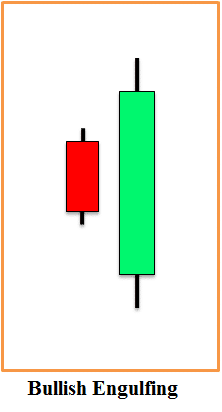
Bullish Engulfing:
Bullish engulfing candlestick pattern is a very strong bullish pattern which indicates a high possibility of a bullish trend in future price movement. This pattern consists of two candlesticks. The first candlestick of this pattern is a small bearish candle and then a massive bullish candle engulfs or covers up the first candle completely.
This heavy bullish candle indicates a very strong buying pressure after a small bearish candle.
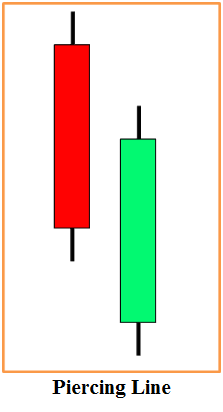
Piercing Line:
Piercing is another bullish candlestick pattern. This pattern is developed with two candlesticks; the first one is long bearish candle indication a weakness. The second candle opens lower than the low point of the first candle but closes more than halfway above the first candle’s real body.
This second candle indicates a heavy buying pressure which has recovered the selling pressure of the previous candle.
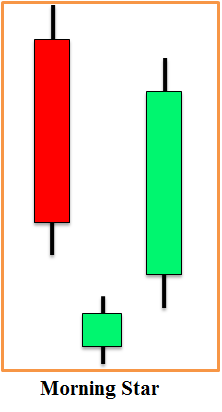
Morning Star:
The morning star pattern is a bullish candlestick pattern which indicates a possibility of bullish reversal after a downtrend. This pattern is formed by three candlesticks. The first candle is a long bearish candle which indicates a heavy sell pressure.
The second candle gaps down from the first candle and it remains bullish or bearish in the end. This second candle indicates that the selling pressure has become weaker. The third candlestick is a long bullish candle which indicates the strength has returned to a strong buying pressure.
Hammer:
Hammer is a bullish candlestick pattern which detects the bullish reversals as it is found in the end of the downtrend. Hammer has a small real body at the top of the candle and a long shadow in the lower part. This indicates that the buyers were so strong that they recovered the selling pressure nicely.
This hammer candle is very effective when found after a short retracement in a major trend. Hammer can be bullish or bearish in its formation. A bearish or red colored hammer also indicates strength but a green or bullish hammer indicates more strength and more possibility to reverse into an uptrend.
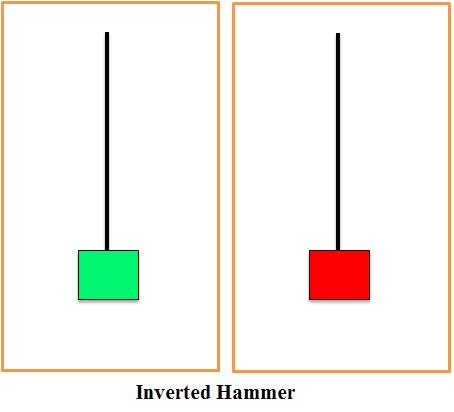
Inverted Hammer:
Inverted hammer is the upside down version of hammer candlestick pattern. It is also a bullish reversal candle which has a small real body in the lower part of the candle. It has a long shadow in the upper part. It is found in a downtrend and represents a possibility of bullish reversal. This pattern’s reliability is strong like a hammer as the long upper shadow indicates a failure to recover the selling pressure. Like the hammer, this pattern can be either bullish or bearish due to its formation.
Bearish Candlestick Patterns:
Bearish patterns indicate bearishness. Traders can use these bearish signals for an exit strategy or taking short positions. Some of the key bearish candlestick patterns are described below,
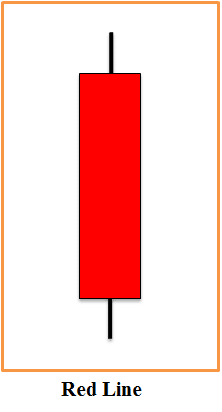
Red Line:
This pattern is the opposite version of the green line candlestick pattern. It is a strong bearish candle. Its open price is near the high and close price is near the low price which indicates a strong sell pressure.
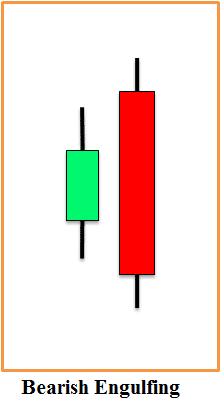
Bearish Engulfing:
The bearish engulfing pattern is the opposite version of bullish engulfing. This pattern is a very strong bearish pattern. This pattern form, when a long bearish candle engulfs or covers the previous small bullish candle completely. This indicates a heavy sell pressure has taken place after a small bullishness.
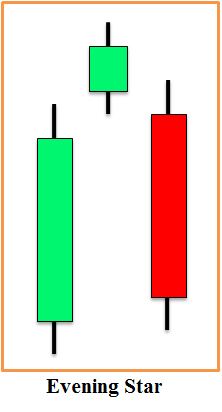
Evening Star:
This is the opposite candlestick pattern of the morning star. It is a bearish reversal pattern which found in an uptrend, and it indicates bearishness. This pattern develops with three different candlesticks.
The first candlestick of this pattern is a long bullish candle, the second one opens with a higher gap and forms a star. Then the third candle becomes a long bearish candle in case of the evening star candlestick pattern. This third candle confirms the strong sell pressure.
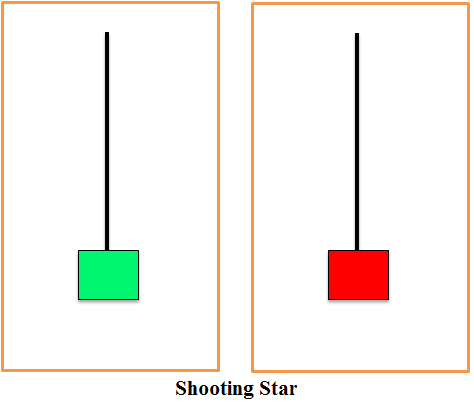
Shooting Star:
This pattern is a bearish reversal pattern which suggests a minor reversal in a bullish trend as it is found at the top of an uptrend. The long upper shadow indicates the strong sell pressure.
Generally, this pattern is reliable, but it becomes stronger when a red colored shooting star found at the top of an uptrend. This pattern is similar to inverted hammer in shape but has the opposite effect as it is found at the top of the uptrend.
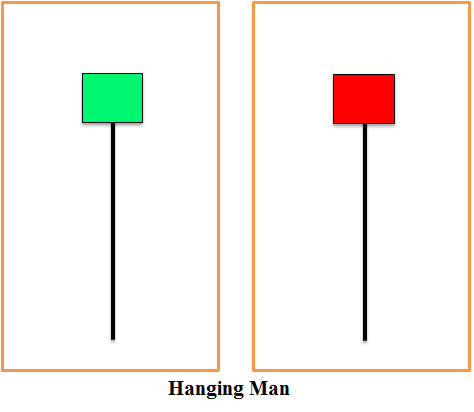
Hanging Man:
This candlestick pattern looks like hammer patterns, but unlike hammers, this pattern found in the end of an uptrend. The shape of hanging man is similar to hammer but found in different trend, and it has a bearish impact on the price.
The hanging man is a bearish reversal candle but its reliability is not as strong as a shooting star. However, a red colored or bearish hanging man has a greater impact on price than a green colored or bullish one.
Neutral Candlestick Patterns:
There are some candlestick patterns which indicate neither bullishness nor bearishness. These candlestick patterns are known as neutral patterns as these indicate indecision. Some important neutral patterns are described below.
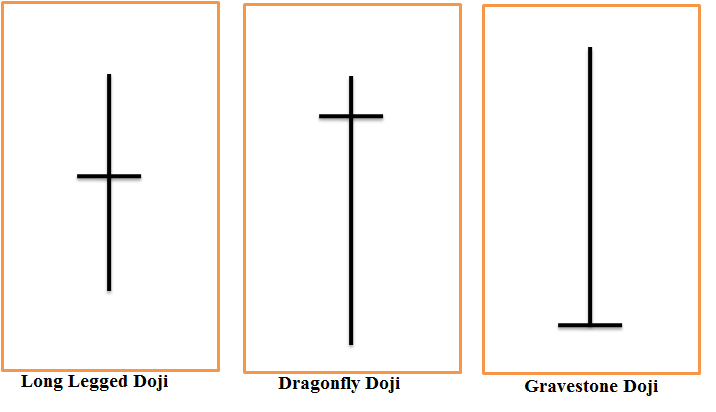
Doji Candlestick Patterns :
This candlestick pattern indicates indecision between buyer and seller. This is a neutral pattern which does not indicate any significant direction of price movement. At this situation, traders assume that price may go either way, so it is better to wait for the confirmation.
A doji candle forms when the open price is at the same point or price. This indicates that neither bull nor bear has won the fight. There are different types of doji candles as per formation of upper and lower shadow. All of them are neutral.
It is called long legged doji candle when the candle has long upper and lower shadow.
A dragonfly doji has long lower shadow and no or little upper shadow.
A gravestone doji candle has long upper shadow and no lower shadow as the open, low and close price is at a similar point or price.
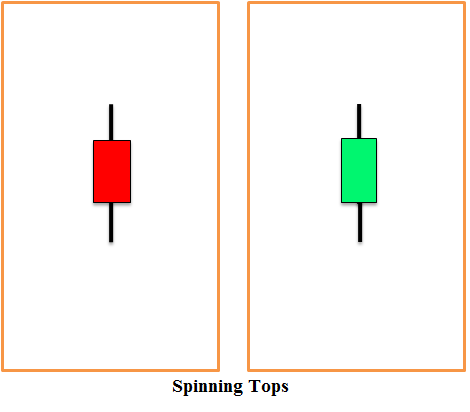
Spinning Tops Candlestick Patterns:
These are also neutral candlestick patterns. The distance between high and low and the distance between the open and close are very small in spinning tops candlestick patterns.
Summary:
The effect of candlestick stays for a very short time, so it is hard to take decisions based on candlesticks only. Traders use other indicators with candlesticks to get a better result.


