ForexEzy
No Result
View All Result
  • Home
  • Forex Education
    • Forex Basics
    • Forex Trading Strategies
    • Money Management
    • Risk Management
    • Technical Analysis
    • Fundamental Analysis
    • Trading Psychology
    • Social Trading
    • Automated Trading
  • Forex Tools
    • Forex Robots
    • Forex Indicators
    • Forex Signals
  • Top Forex Brokers
  • Top Forex Robots
  • Commentary
  • Blog
No Result
View All Result
ForexEzy
No Result
View All Result
Home Forex Education Technical Analysis

Forex Pivot Points Trading Strategy Explained

by Tim Baudin
September 8, 2016
in Technical Analysis
0
Forex Pivot Points Trading Strategy Explained
0
SHARES
11
VIEWS
Share on FacebookShare on Twitter

Pivot points are levels of support and resistance in the market. They are calculated with a mathematical formula that uses the previous trading period data. Below video covers a strategy I’ll call the ‘’Big Dog Trading Strategy.’’
The system mainly focuses on trading pivot points.

https://youtu.be/Z1TJwNg_gUU

What are pivot points?

Pivot points are levels of support and resistance in the market. They are calculated with a mathematical formula that uses the previous trading period data. The most commonly used previous trading period is the previous day and the pivots plotted by using the previous day’s data are called daily pivots.

You don’t need to calculate these levels by yourself as most trading platforms these days will do it automatically for you.

Why are pivot points important?

– As the name of the strategy implies these levels are frequently used by the so-called ‘’Big Dog Traders’’, namely institutional banks, hedge funds and traders on large forex trading desks. Furthermore pivot points have a history of being used in other financial markets, decades before forex trading got into the mainstream

– Price tends to respect Pivot Points

– Pivot Points can be used as strong levels of support and resistance

– Pivot Points can be used as entry and/or exit levels

What trading period should you use?

It’s recommended that you use the daily weekly and monthly pivots. These levels tend to give the best results with the hourly pivots falling short in terms of relevance.

How do you trade pivot pivots?

The strategy shown in the video uses only 2 trading indicators: a 200 moving average to spot the trend and a pivot points indicator. The slope of the 200 MA is an indication of a trend. An upward sloping moving average indicates that we are in an uptrend. Please look at the chart below.

Pivot-point-1

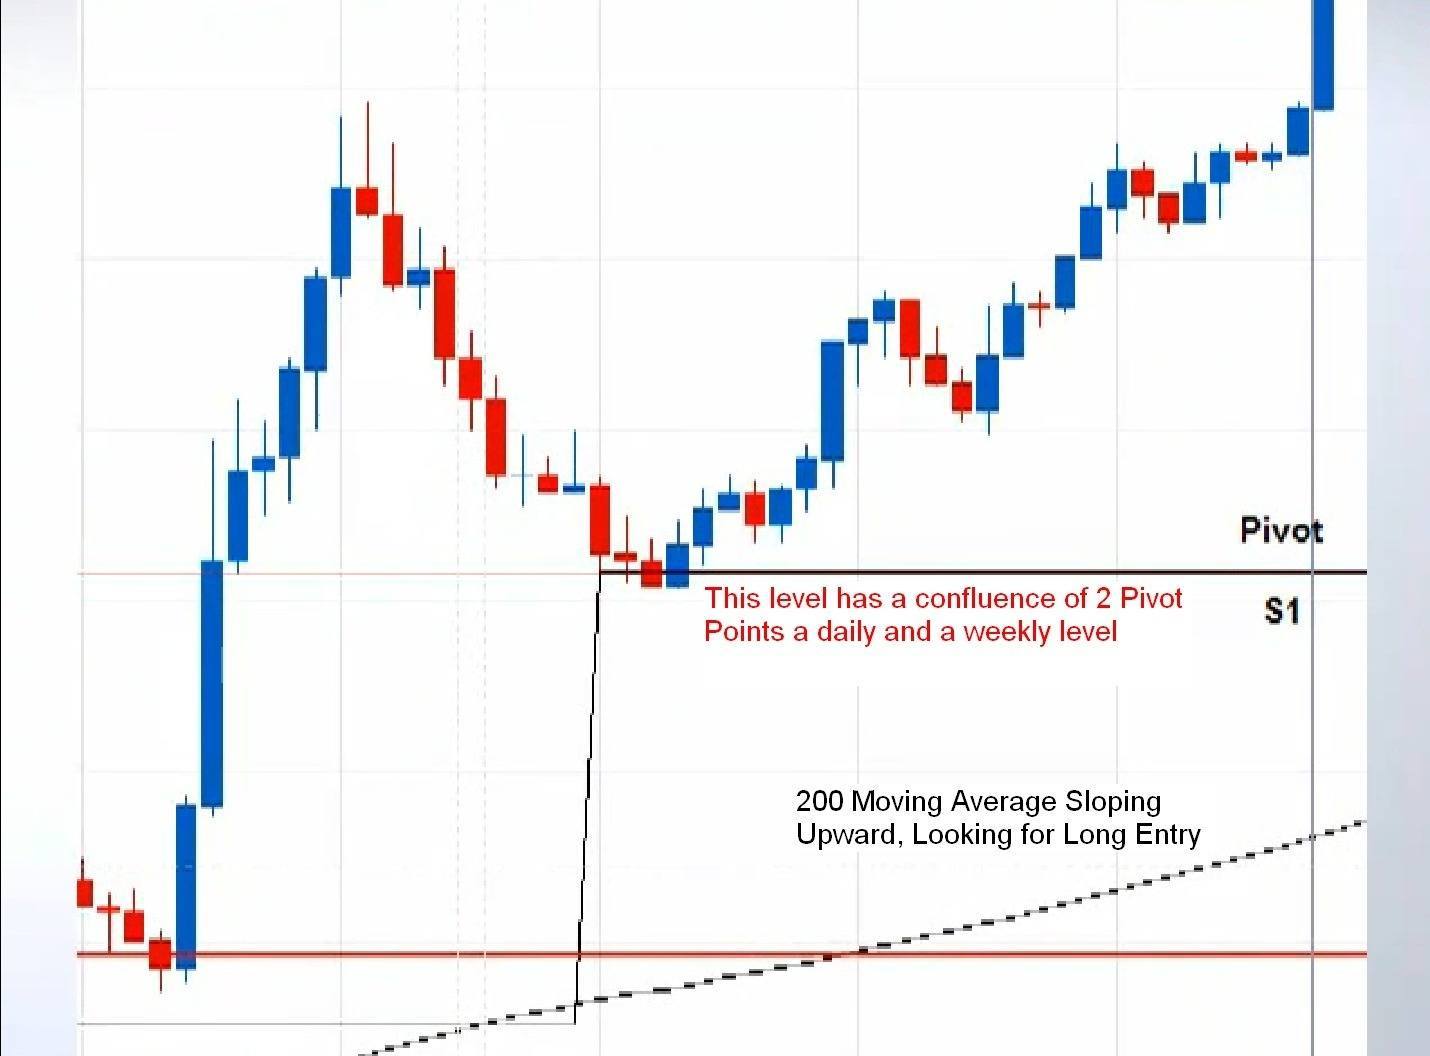
After an initial breakout to the upside price comes back down and tests the S1 Pivot Point level. This level has a confluence of 2 Pivot Points, a daily and a weekly level, thus increasing its importance.

Where to enter a trade?

Pivot Points are important levels of support and resistance but you cannot trade them indiscriminately and enter on every pivot level expecting a reaction.

Here’s a good method of entry and filtering of bad entries, look at the chart below.

Pivot-point-2

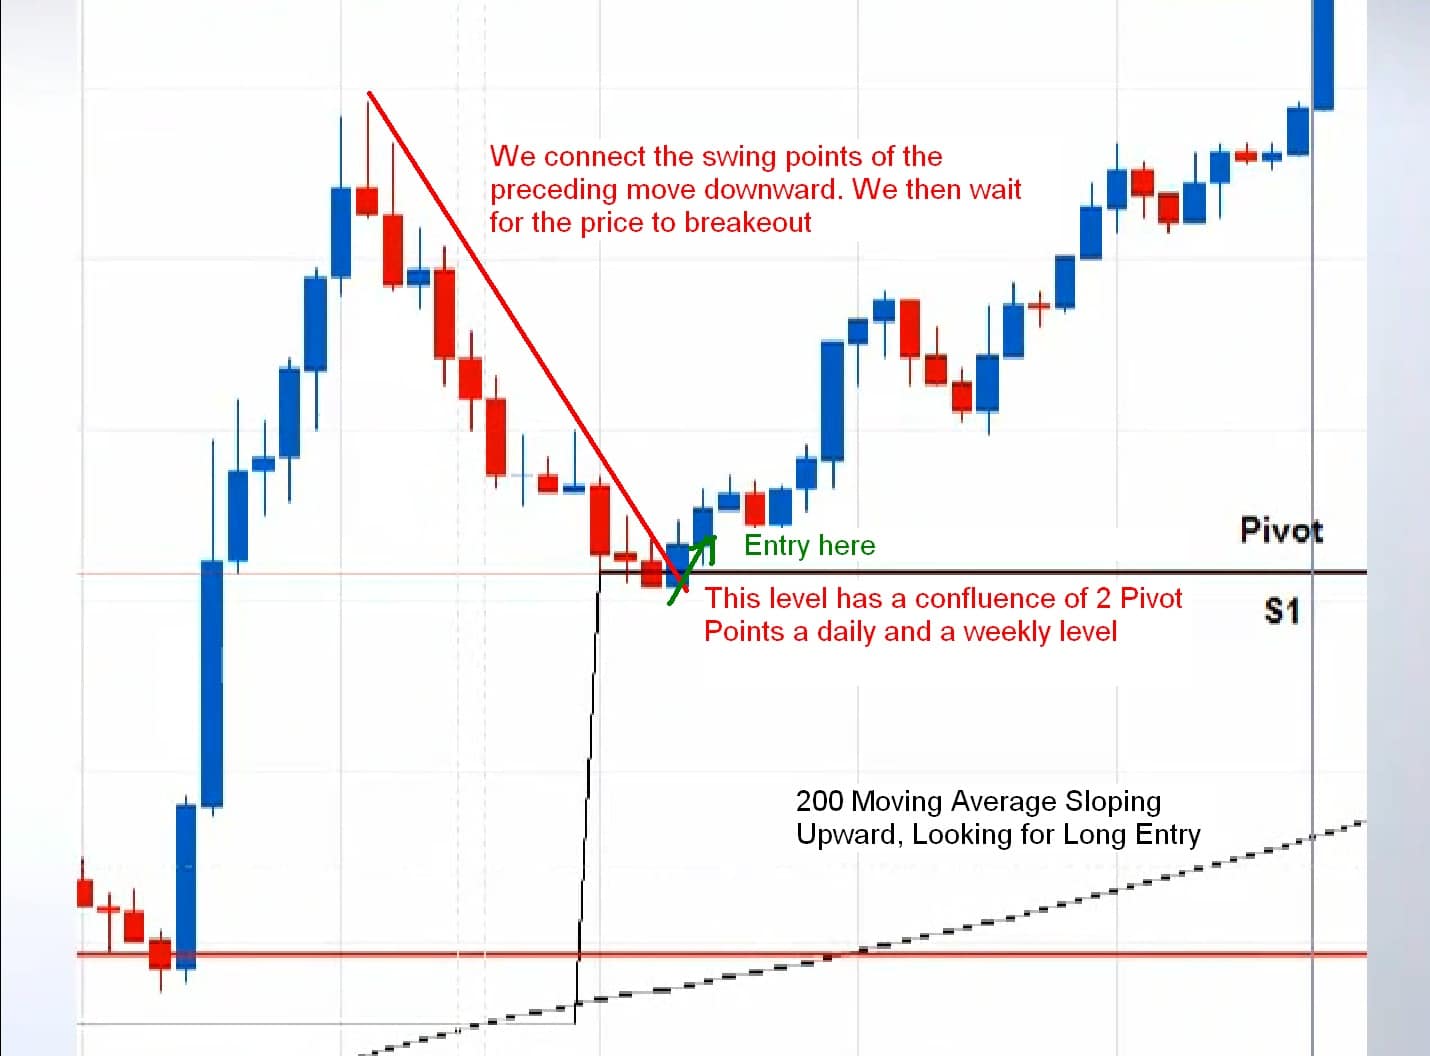
As explained in video how after price retraces and touches the S1 pivot point we can use a trendline and connects the swing points of the preceding to move downward.

We can then wait for the price to breakout above the trendline before initiating a long entry.

Where to exit a profitable trade?

The trading strategy is shown in the video is not using main pivot points as the target, as price doesn’t move that far very often. You can usually exit at the middle point between the main pivot points.

These are called M Pivots. For example between S1 and S2 you have the M1 Pivot Point, between S2 and S3 you have an M2 pivot. As shown in the example above, you can set take profit level at the nearest M pivot to the upside.

ShareTweet
Previous Post

Trading With Spinning Tops and Doji Candlestick Pattern

Next Post

How to Use Fibonacci Retracement Levels in Forex Trading

Related Posts

How to Trade Using Horn Bottoms in Bullish Markets

How to Trade Using Horn Bottoms in Bullish Markets

by Chintan Patel
April 16, 2021
0

Introduction Horn bottoms are down-trending spikes on trading charts. The pattern consists of two spikes that are visible on the...

An Introduction To Forex Momentum Indicators

An Introduction To Forex Momentum Indicators

by Tim Baudin
January 19, 2021
0

Overview There is a recurring belief in trading communities that price lies, but momentum doesn’t. The forex market is somewhat...

An Introduction To Forex Indicators

An Introduction To Forex Indicators

by Chintan Patel
January 1, 2021
0

What are the Forex indicators? A vast part of technical analysis is understanding and trading with these tools. Although they...

Using Trendlines and Saucer Formations in Trading

Using Trendlines and Saucer Formations in Trading

by Tim Baudin
December 21, 2020
0

Trendlines are those lines that you can recognize easily. A trader draws trendlines on charts in order to connect a...

RSI - Top 3 Real Charts You've Missed

RSI – Top 3 Real Charts You’ve Missed

by Tim Baudin
December 17, 2020
0

Overview Are you still doubting the power of the RSI? This article will cover three recent forex trading opportunities mostly...

Load More

Best Forex EA

  • ROFX 9/10
  • Forex Fury 8/10
  • FXgoodway 7.5/10
  • Z Trader FX EA 7/10
  • Forex Incontrol Reborn 6.5/10

Popular News

  • The Best RSI and CCI Combination Trading Strategy for Optimum Returns

    The Best RSI and CCI Combination Trading Strategy for Optimum Returns

    2 shares
    Share 2 Tweet 0
  • Rofx Review – High Profitability and Stable Performance Analysis

    29 shares
    Share 29 Tweet 0
  • The Best Forex Scalping Strategy – Using 3 Popular Technical Indicators

    0 shares
    Share 0 Tweet 0
  • The Best MT4 Indicators & Expert Advisors For Forex Trading

    2 shares
    Share 2 Tweet 0
  • How to check if the indicator is repainting?

    2 shares
    Share 2 Tweet 0

Trading

Footer

We are dedicated to demystify the world of forex trading for you – no matter what level you are on.

Categories
  • Automated Trading
  • Day Trading
  • Forex Basics
  • Forex Brokers
  • Forex Education
  • Forex Forecasts
  • Forex Indicators
  • Forex Market Commentary
  • Forex Robots
  • Forex Signals
  • Forex Tools
  • Forex Trading Strategies
  • Fundamental Analysis
  • Money Management
  • News
  • Risk Management
  • Social Trading
  • Technical Analysis
  • Top World Traders
  • Trading Psychology
  • Uncategorized
Tags
arbitrage atr bollinger bands cci chart patterns classics copy trading courses day trading forex brokers forex charts forex ea forex education forex forecasting Forex Indicators forex software reviews grid trading hedging ichimoku macd market cycles news trading oscillators price action trading rsi social trading strategies tips & tricks trading bots trading platforms trend trading Video
  • Terms of Use
  • Privacy Policy
  • Compensation Disclosure
  • Risk Disclosure
  • About Us
  • Contact Us

Copyright © 2021 by ForexEzy.com

No Result
View All Result
  • Home
  • Forex Education
    • Forex Basics
    • Forex Trading Strategies
    • Money Management
    • Risk Management
    • Technical Analysis
    • Fundamental Analysis
    • Trading Psychology
    • Social Trading
    • Automated Trading
  • Forex Tools
    • Forex Robots
    • Forex Indicators
    • Forex Signals
  • Top Forex Brokers
  • Top Forex Robots
  • Commentary
  • Blog

© 2021, Forexezy.