Fibonacci is a series of numbers developed by Leandro Fibonacci. In this series, one number derives from the sum of two previous numbers. Here is an example of Fibonacci numbers,
1, 2, 3, 5, 8, 13, 21, 34 and so on.
After first two numbers, (1 and 2) all the numbers are the sum of two previous numbers.
How can these numbers help you in trading? These numbers can be used in trading. There are some trading tools developed using Fibonacci numbers. Such as, Fibonacci retracement, Fibonacci arc, Fibonacci fan. Fibonacci retracement is widely used and extremely popular among Fibonacci trading tools.
Fibonacci Retracements Levels :
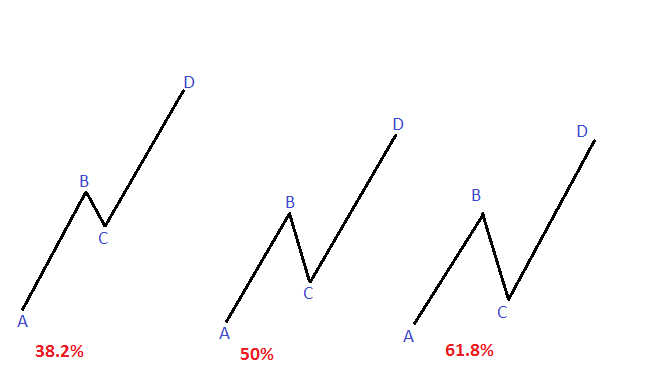
Currency pairs/stocks or any other financial assets have a tendency to pullback or bounce back to its previous trend after a retracement. This retracement occurs at three levels. These levels are 38.2%, 50%, and 61.8%. 61.8% . Retracement level is very important as most of the time pairs bounce back from this retracement level. Here is an example figure showing these retracement levels.
In the figure above, we can see three different retracement levels. The first figure showing 38.2% retracement as BC = 38.2% of AB. The second figure showing a retracement of 50% and BC = 50% of AB. The third figure is showing 61.8% retracement as BC = 61.8% of AB. AB is showing an upward movement in all three figures. BC is the retracement and CD are the pullback or bounce back to its previous trend after the retracement.

How to draw Fibonacci retracement:
Fibonacci retracement is a drawing tool. You have to draw it manually in a chart. There are some indicators for Fibonacci retracement tool. These tools are not reliable always as they are developed under strict calculation. Due to this strict calculation, Fibonacci indicators might not be able to present the Fibonacci retracement in proper time and price range.
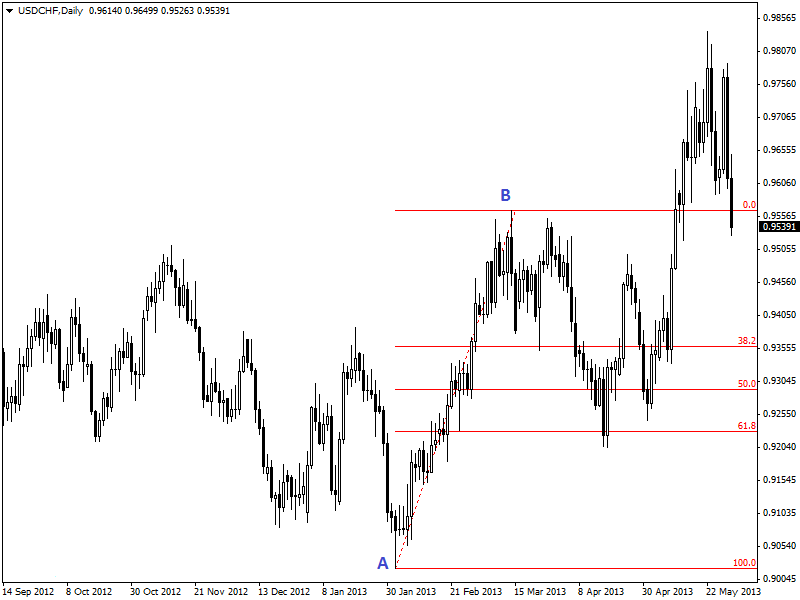
It is far better if you draw Fibonacci retracement manually. The trend is an important thing to consider before drawing Fibonacci retracement. Drawing technique is different in bullish and bearish trend. In a bullish trend or uptrend, you have to draw Fibonacci retracement from the low point to the high point of the trend. Here is an example of drawing Fibonacci retracement in a bullish trend.

In the daily chart of USD/CHF (given above), Fibonacci retracement has drawn from the low point (A) to the high point (B). The pair has then retraced about 61.8% and then bounced to the previous significant trend.
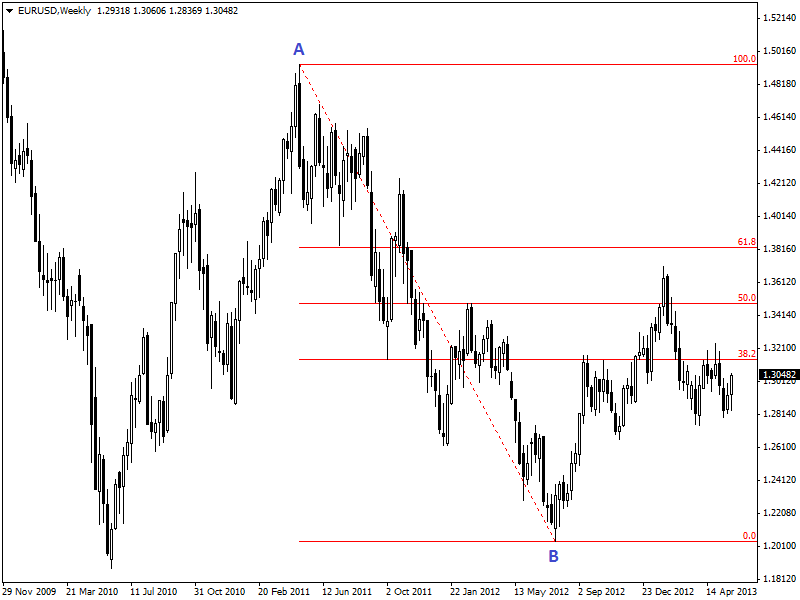
In the case of the bearish market, you have to draw Fibonacci retracement from high point to the low point of the bearish trend. Here is an example is given below,

In the daily weekly chart of EUR/USD (given above), Fibonacci retracement has drawn from the high point (A) to the low point (B) of the bearish trend. This pair has retraced near 61.8% and then bounced back to its previous bearish trend.


