ForexEzy
No Result
View All Result
  • Home
  • Getting Started with Forex
  • Forex Education
    • Forex Basics
    • Forex Trading Strategies
    • Money Management
    • Risk Management
    • Technical Analysis
    • Fundamental Analysis
    • Trading Psychology
    • Social Trading
    • Automated Trading
  • Forex Tools
    • Forex Robots
    • Forex Indicators
    • Forex Signals
  • Top Forex Brokers
  • Top Forex Robots
  • Commentary
  • Blog
No Result
View All Result
ForexEzy
No Result
View All Result
Home Forex Education Technical Analysis

Difference between Retracements and Reversals

by Tim Baudin
September 8, 2016
in Technical Analysis
0
Difference between Retracements and Reversals
0
SHARES
11
VIEWS
Share on FacebookShare on Twitter

In a major trend,  a pair tends to retrace and bounce back. Sometimes these retracements turn into reversals. Retracements are just a small and temporary reversal in a prolonged trend.

In many cases, traders get confused about retracement and reversal in a major trend.

https://youtu.be/HWXeo8oibQc

There are many significant differences between retracements and reversals. Once a trader knows these differences then he/she will be able to judge it is reversal or retracement.

Retracements and Reversals:

In the major trends,  there might be some short and temporary reversals. These reversals are known as retracements. These retracements can be measured by Fibonacci retracements levels. These retracements are just a short opposite movement to the major trend which is not a trend reversal.

Trend reversal occurs when the major trend is not valid and reversed to the opposite direction.  Here is an example of retracements and reversals in a prior uptrend.

retracements-and-reversals-1

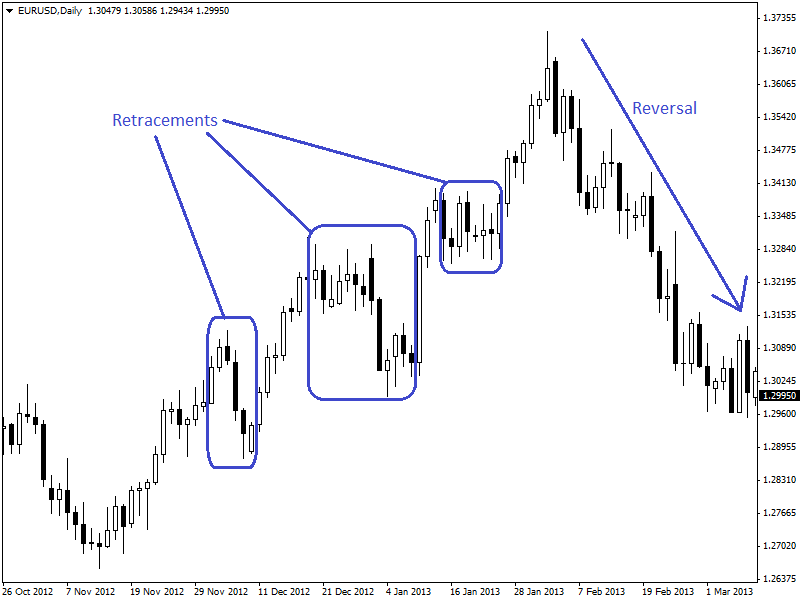
Retracements and reversals have shown in the daily chart of EUR/USD (given above).

There are some differences between the formation of retracements and reversals. These are very effective to know whether it is retracement or reversal. These differences are described below,

Chart Patterns:

Retracements and reversals contain different chart patterns. Retracements form continuation chart patterns like flags and pennants. On the other hand, reversals form reversal chart patterns like head and shoulders, double top and double bottom.

Time Frame:

Retracements take a small time to form. It takes less than two weeks in the daily chart. On the other hand, reversals take much time than retracements. Reversals take more than two weeks to occur in the daily chart.

Recent Price Movement:

Retracements generally occur after a rapid and large price hikes. On the other hand, reversals can be found after a rapid price hike or after a ranging condition. Most of the cases, reversals occur after a ranging condition.

Candlesticks:

During retracements, candlesticks are mostly neutral in nature. These neutral candlesticks are doji, spinning tops and bottoms etc. On the other hand, reversals include stronger candlestick patterns like engulfing, soldiers etc.

Determining Scope of Retracement:

The scope of retracement can be determined after identifying retracements. This scope of retracement can be determined by using trend lines, Fibonacci retracements, moving averages etc.

Trend Lines:

Trend lines are very useful to determine the scope of retracements. Trend line also works as a support and resistance for the retracement and thus pullbacks occur from trend lines. In an uptrend, trend line works as a support level. Inversely, trend line works as a resistance level in a downtrend. Here is an example in the daily chart of USD/JPY.

retracements-and-reversals-2

Fibonacci Retracements:

Fibonacci retracement levels are very useful to determine the scope of retracement in the forex market. Most of the cases retracements occur up to 38.2% to 50%. In many cases, retracements may also occur up to 61.8% level. If these levels fail to hold the retracement, then this is an indication of a trend reversal.

Here is an example in the daily chart of USD/JPY.

retracements-and-reversals-3

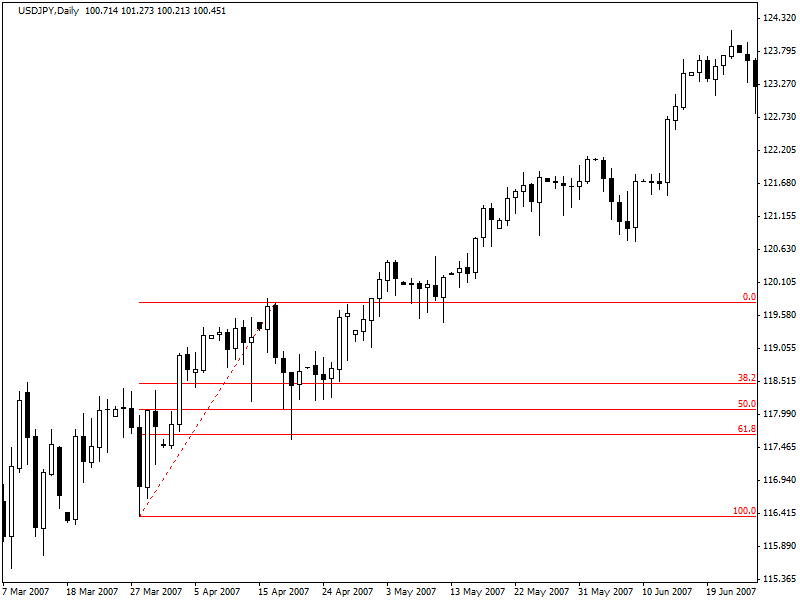
In the chart,  (given above) we can see that USD/JPY retraced up to 61.8% Fibonacci retracement level and then bounced back in its previous trend.

Moving Averages:

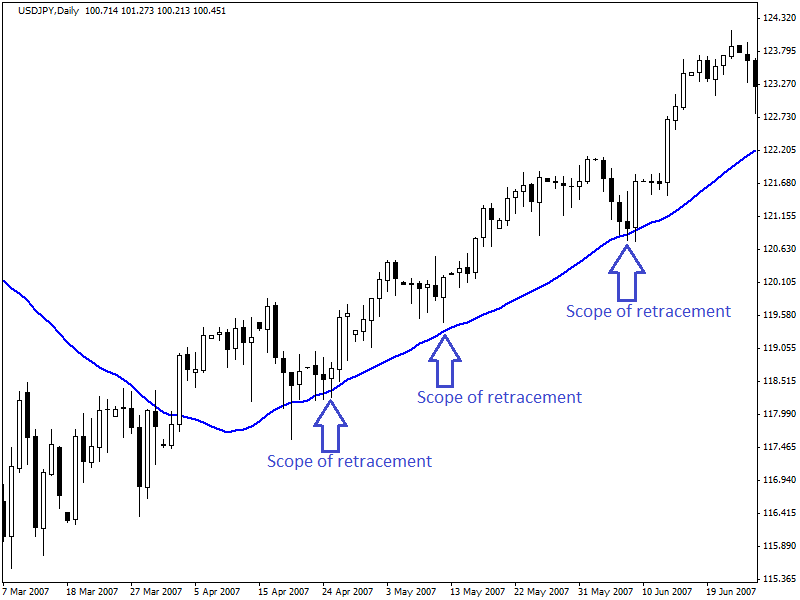
Moving averages can also measure the scope of retracement. Moving averages works as dynamic support and resistance. Most of the cases, retracements occur up to the dynamic support or resistance of moving averages.

In an uptrend, moving averages work as dynamic support and work as dynamic resistance in a downtrend. Here is an example.

retracements-and-reversals-4

Minimizing Risk:

Technical analysis is not an exact science, and there is no Holy Grail strategy or indicator in trading. Thus, a retracement can become a reversal without giving a significant sign of reversal. In this situation, you might get a losing trade.

You can not avoid losses totally, but you can minimize the risk or loss. To minimize the risk, a trader should have a stop loss strategy. This stop loss can be determined in various ways. Such as,

  •  Determine the scope of retracement by Fibonacci retracement levels and place stop loss below these retracement levels.
  •  Place a stop loss below the long term support/resistance or trend line.
  •  Or, you can use a fixed stop loss, such as 40 pips below/above the entry price. 

Summary:

Differences between retracements and reversals are very important in trading. A trader might miss trading opportunities, trade false signals and hold losing position without knowing these differences between retracements and reversals.

Proper use of drawing tools (Fibonacci retracements, trend lines, support resistances etc) will help a lot to overcome these problems.

ShareTweet
Previous Post

How to Use Fibonacci Retracement Levels in Forex Trading

Next Post

Simple Guide to Elliot Wave Trading

Related Posts

An Introduction To Forex Momentum Indicators

An Introduction To Forex Momentum Indicators

by Tim Baudin
January 19, 2021
0

Overview There is a recurring belief in trading communities that price lies, but momentum doesn’t. The forex market is somewhat...

An Introduction To Forex Indicators

An Introduction To Forex Indicators

by Chintan Patel
January 1, 2021
0

What are the Forex indicators? A vast part of technical analysis is understanding and trading with these tools. Although they...

Using Trendlines and Saucer Formations in Trading

Using Trendlines and Saucer Formations in Trading

by Tim Baudin
December 21, 2020
0

Trendlines are those lines that you can recognize easily. A trader draws trendlines on charts in order to connect a...

RSI - Top 3 Real Charts You've Missed

RSI – Top 3 Real Charts You’ve Missed

by Tim Baudin
December 17, 2020
0

Overview Are you still doubting the power of the RSI? This article will cover three recent forex trading opportunities mostly...

The Trading Indicator You Have not Heard of – The Williams %R

The Trading Indicator You Have not Heard of – The Williams %R

by Adam Stanley
December 1, 2020
0

The Williams Percentage Range is a highly effective tool that measures price variations over a period of time for various...

Load More

Best Forex EA

  • ROFX 9/10
  • Forex Fury 8/10
  • FXgoodway 7.5/10
  • Z Trader FX EA 7/10
  • Forex Incontrol Reborn 6.5/10

Popular News

  • The Best RSI and CCI Combination Trading Strategy for Optimum Returns

    The Best RSI and CCI Combination Trading Strategy for Optimum Returns

    2 shares
    Share 2 Tweet 0
  • Rofx Review – High Profitability and Stable Performance Analysis

    29 shares
    Share 29 Tweet 0
  • The Best Forex Scalping Strategy – Using 3 Popular Technical Indicators

    0 shares
    Share 0 Tweet 0
  • The Best MT4 Indicators & Expert Advisors For Forex Trading

    2 shares
    Share 2 Tweet 0
  • How to check if the indicator is repainting?

    2 shares
    Share 2 Tweet 0

Trading

Footer

We are dedicated to demystify the world of forex trading for you – no matter what level you are on.

Categories
  • Automated Trading
  • Day Trading
  • Forex Basics
  • Forex Brokers
  • Forex Education
  • Forex Forecasts
  • Forex Indicators
  • Forex Market Commentary
  • Forex Robots
  • Forex Signals
  • Forex Tools
  • Forex Trading Strategies
  • Fundamental Analysis
  • Money Management
  • News
  • Risk Management
  • Social Trading
  • Technical Analysis
  • Top World Traders
  • Trading Psychology
  • Uncategorized
Tags
arbitrage atr bollinger bands cci chart patterns classics copy trading courses day trading forex brokers forex charts forex ea forex education forex forecasting Forex Indicators forex software reviews grid trading hedging ichimoku macd market cycles news trading oscillators price action trading rsi social trading strategies tips & tricks trading bots trading platforms trend trading Video
  • Terms of Use
  • Privacy Policy
  • Compensation Disclosure
  • Risk Disclosure
  • About Us
  • Contact Us

Copyright © 2020 by ForexEzy.com

No Result
View All Result
  • Home
  • Getting Started with Forex
  • Forex Education
    • Forex Basics
    • Forex Trading Strategies
    • Money Management
    • Risk Management
    • Technical Analysis
    • Fundamental Analysis
    • Trading Psychology
    • Social Trading
    • Automated Trading
  • Forex Tools
    • Forex Robots
    • Forex Indicators
    • Forex Signals
  • Top Forex Brokers
  • Top Forex Robots
  • Commentary
  • Blog

© 2020, Forexezy.