Using Elliot Wave for trading is probably the most confusing way and hardest type of technical analysis for newer traders. Even after trading for a few years I don’t use this method because of the subjectivity and complexity attached to it.
What is the Elliot Wave Principle?
The Elliot Wave principle is a form of TA that relies on trying to predict future market cycles and trends. It’s a quite old prediction tool, dating back to the book “The Wave Principle” published in 1938 by R.N. Elliott’.
Here’s why the strategy works according to the author:
“Because man is subject to the rhythmical procedure, calculations having to do with his activities can be projected far into the future with a justification and certainty heretofore unattainable”.
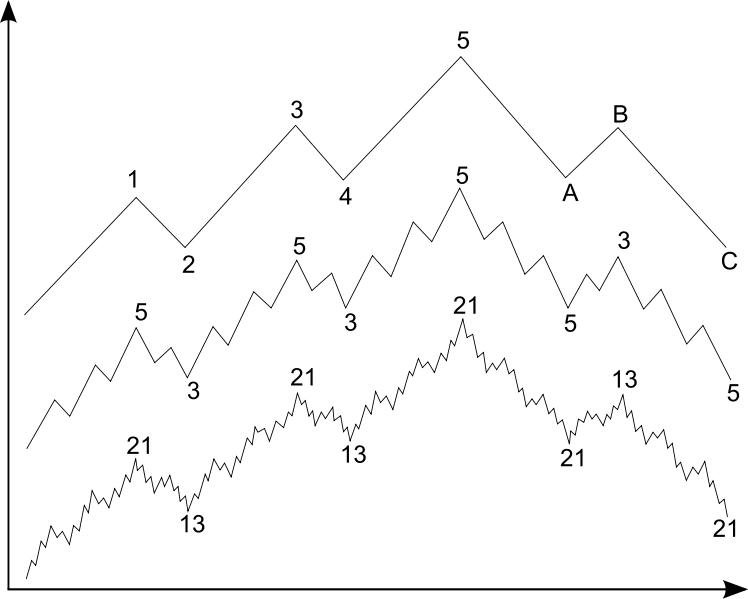
The chart below shows a basic example of a five wave Elliot Wave.

Elliot Wave is a fractal theory too, meaning each of the five waves can be sub-divided into smaller 5 waves. Those 5 waves can be subdivided into another five waves etc going lower and lower in timeframes. The second and third example of the picture above show the fractal nature of this theory.
The first, third and fifth wave are impulse waves while the second and forth are corrective waves. There are 3 important rules that the different waves must follow in order to to have a correct wave count:
Rule number 1: Wave two never retraces more than 100% of wave one
Rule number 2: Wave three can’t be the shortest of the 3 impulse waves
Rule number 3: Wave four does not overlap with wave one
As I personally do not use this tool to analyze my charts I can’t make a verdict to its predictive validity but the video makes a nice introduction to this theory.


