ForexEzy
No Result
View All Result
  • Home
  • Getting Started
  • Forex Education
    • Forex Basics
    • Forex Trading Strategies
    • Money Management
    • Risk Management
    • Technical Analysis
    • Fundamental Analysis
    • Trading Psychology
    • Social Trading
    • Automated Trading
  • Forex Tools
    • Forex Robots
    • Forex Indicators
    • Forex Signals
    • Forex VPS
  • Top Forex Brokers
    • Best Forex Brokers
    • US Forex Brokers
    • UK Forex Brokers
    • MT4 Forex Brokers
    • MT5 Forex Brokers
    • Zero Spread Brokers
    • Best PayPal Brokers
    • TradingView Brokers
    • Social Trading Platforms
  • Top Forex Advisors
    • Best Forex Robots
    • Best Forex Signals
    • Best Managed Accounts
  • Forex Forecast
  • Crypto
    • Best Crypto Exchanges
    • Best Crypto Bots
    • Crypto Guides & Forecasts
No Result
View All Result
ForexEzy
No Result
View All Result
Home Forex Education Technical Analysis

Positive Volume Index (PVI) and Negative Volume Index (NVI)

by Tim Baudin
September 8, 2016
in Technical Analysis
0
0
SHARES
11
VIEWS
Share on FacebookShare on Twitter

Positive Volume Index (PVI):

Positive volume index (PVI) is a volume based indicator which is based on days where trading volume has increased from the previous day. PVI indicator was developed by Paul Dysart in 1930s. This indicator helps traders to understand the activity of smart money.

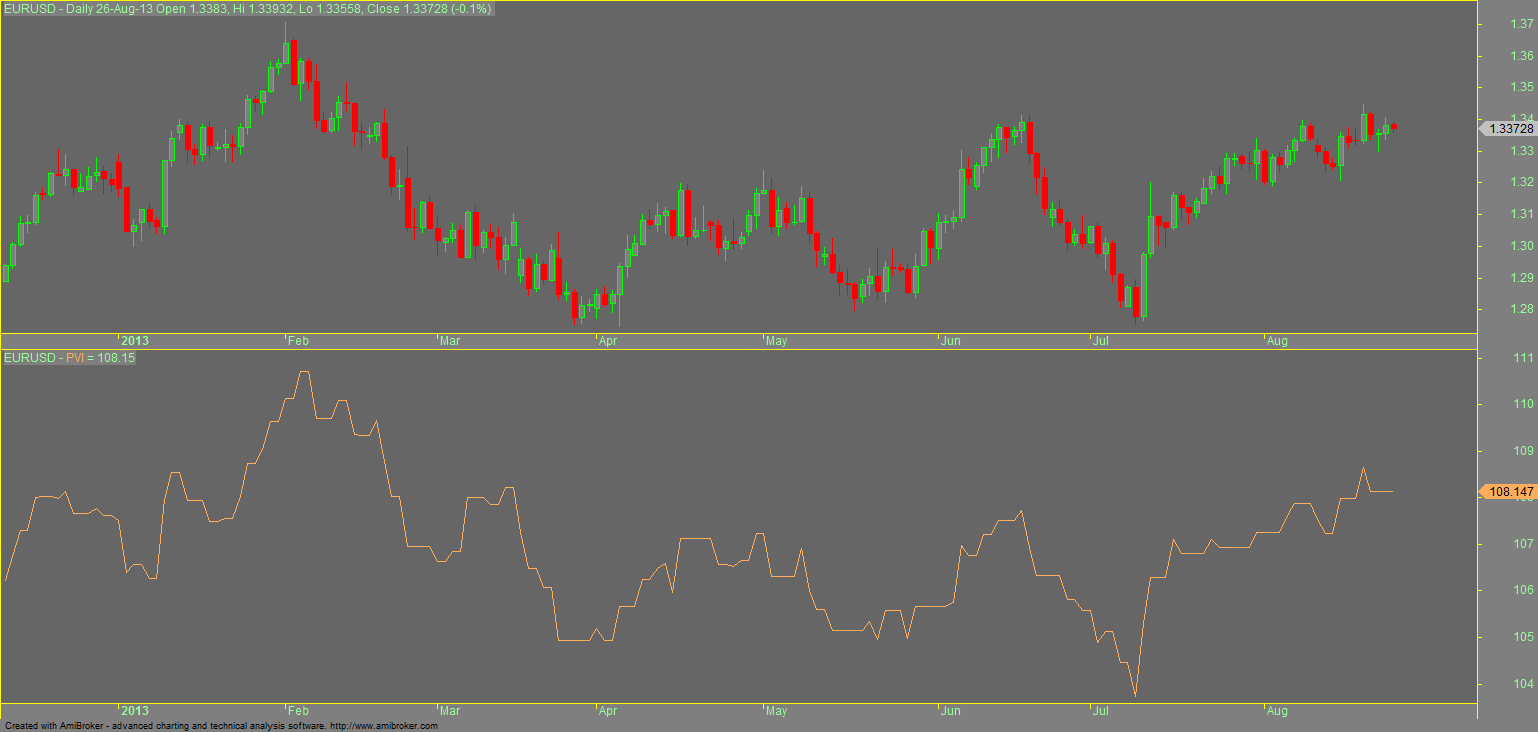
PVI counts days when trading volume is higher than the previous period. This tells traders that smart money is active or not. PVI is more beneficial to identify the bear market. Here is an example in the daily chart of EUR/USD given below.

Positive-Volume-Index-PVI

Negative Volume Index (NVI):

Negative volume index is also a volume based indicator that can give ideas about the activities of smart money. The structure of this indicator is just opposite to the PVI indicator.

NVI measures the price change % when the trading volume declines. This indicator is used to identify the bullish market. Here is an example of NVI in the daily chart of EUR/USD.

Negative-Volume-Index-NVI

Trading Tactics:

PVI and NVI can be used individually and as a combination. PVI mostly used to detect divergences between price change % and volume. Inversely, NVI is useful to determine trend reversals with the help of divergence.

Increasing price with decreasing volume of NVI is a strong buy signal. Inversely, decreasing price with increasing volume indicates strong weakness.

The best method to use these two indicators is to combine them together. In this case,  PVI and NVI generate crossover signals. However, PVI and NVI are used to analyze market condition.

Most of the traders use this indicator to understand the market condition and smart money activity. Generally, traders do not use these indicators for making a buy or sell decision.

The Best Forex Robots Report Is Already Here!
Check out 30+ best expert advisors with daily updated live results and statistics.
ShareTweet
Previous Post

Simple Guide to Elliot Wave Trading

Next Post

Easy Forex Beginner Strategy

Related Posts

Trading With Balance of Power Indicator

Trading With Balance of Power Indicator

by Adam Stanley
December 9, 2021
0

The Balance of Power (BOP) indicator is an analysis tool created by Igor Livshin in August 2001. It tracks the...

What Are Pennant Chart Patterns in Forex: Step by Step Guide

What Are Pennant Chart Patterns in Forex: Step by Step Guide

by Chintan Patel
November 15, 2021
0

Continuation patterns in the forex market are a common occurrence whenever there is a large movement in one direction followed...

How To Trade Ascending Scallops in Forex

How To Trade Ascending Scallops in Forex

by Adam Stanley
November 10, 2021
0

Price in the Forex market does not always move in one direction. After a significant move in one direction, up...

Inverted Scallops in Forex Chart Patterns: Step by Step Guide

Inverted Scallops in Forex Chart Patterns: Step by Step Guide

by Adam Stanley
November 9, 2021
0

Whenever prices move up significantly in the forex market, exhaustion often kicks in. In most cases, the fatigue is usually...

Elder’s Method in Forex Trading

Elder’s Method in Forex Trading

by Tim Baudin
November 3, 2021
0

There are several strategies that traders and analysts have developed over the years, all in a bid to milk the...

Load More

Best Forex Automated Systems

  • TechBerry 9/10
  • Happy Galaxy 8.5/10
  • Forex Cyborg 8.5/10
  • Forex Fury 8/10
  • FXgoodway 7.5/10

Best Crypto Bots

  • Bitsgap 9/10
  • Cryptohopper 8.5/10
  • Pionex 7.5/10

Top Trading Markets

We are dedicated to demystify the world of forex trading for you – no matter what level you are on.

Categories
  • Automated Trading
  • Cryptocurrency Trading
  • Day Trading
  • Forex Basics
  • Forex Brokers
  • Forex Education
  • Forex Forecasts
  • Forex Indicators
  • Forex Market Commentary
  • Forex Robots
  • Forex Signals
  • Forex Tools
  • Forex Trading Strategies
  • Forex VPS
  • Fundamental Analysis
  • Managed Accounts
  • Money Management
  • News
  • Risk Management
  • Social Trading
  • Technical Analysis
  • Top World Traders
  • Trading Apps
  • Trading Psychology
  • Uncategorized
Tags
arbitrage atr Avalanche AVAX Coin bollinger bands cci chart patterns classics copy trading courses Crypto day trading forex brokers forex charts forex ea forex education forex forecasting Forex Indicators forex software reviews grid trading hedging ichimoku macd market cycles news trading oscillators Polkadot price action trading rsi social trading SOL Solana strategies tips & tricks trading bots trading platforms trend trading Video
  • Terms of Use
  • Privacy Policy
  • Compensation Disclosure
  • Risk Disclosure
  • About Us
  • Contact Us

Copyright © 2022 by ForexEzy.com

No Result
View All Result
  • Home
  • Getting Started
  • Forex Education
    • Forex Basics
    • Forex Trading Strategies
    • Money Management
    • Risk Management
    • Technical Analysis
    • Fundamental Analysis
    • Trading Psychology
    • Social Trading
    • Automated Trading
  • Forex Tools
    • Forex Robots
    • Forex Indicators
    • Forex Signals
    • Forex VPS
  • Top Forex Brokers
    • Best Forex Brokers
    • US Forex Brokers
    • UK Forex Brokers
    • MT4 Forex Brokers
    • MT5 Forex Brokers
    • Zero Spread Brokers
    • Best PayPal Brokers
    • TradingView Brokers
    • Social Trading Platforms
  • Top Forex Advisors
    • Best Forex Robots
    • Best Forex Signals
    • Best Managed Accounts
  • Forex Forecast
  • Crypto
    • Best Crypto Exchanges
    • Best Crypto Bots
    • Crypto Guides & Forecasts

© 2022, Forexezy.