ForexEzy
No Result
View All Result
  • Top Forex Advisors
    • Best Forex Robots
    • Best Forex Signals
    • Best Managed Accounts
  • Top Forex Brokers
    • Best Forex Brokers
    • US Forex Brokers
    • UK Forex Brokers
    • MT4 Forex Brokers
    • MT5 Forex Brokers
    • Zero Spread Brokers
    • Best PayPal Brokers
    • TradingView Brokers
    • Social Trading Platforms
  • Top Review Platforms
  • Forex Education
    • Getting Started
    • Forex Basics
    • Forex Trading Strategies
    • Money Management
    • Risk Management
    • Technical Analysis
    • Fundamental Analysis
    • Trading Psychology
    • Social Trading
    • Automated Trading
  • Forex Tools
    • Forex Robots
    • Forex Indicators
    • Forex Signals
    • Forex VPS
  • Forex Forecast
  • Crypto
    • Best Crypto Exchanges
    • Best Crypto Bots
    • Crypto Guides & Forecasts
No Result
View All Result
ForexEzy
No Result
View All Result
The World’s Leading Social Trading Platform
Try now
Home Forex Tools Forex Indicators

Volume Indicators Comparison: OBV vs. MFI vs. Accumulation/Distribution

by Richard Brase
July 26, 2021
in Forex Indicators
0
Volume Indicators Comparison: OBV vs. MFI vs. Accumulation/Distribution
0
SHARES
11
VIEWS
Share on FacebookShare on Twitter

Do you know what the financial assets most used by traders have in common? The correct answer is volume.

If I told you that volume is an essential thing in trading, would you believe me?

When traders analyze different markets, they are guided by technical and fundamental analysis. But, are you able to read a chart using only indicators or news?

For many retail traders, the answer is no because indicators are based on time and not money.

Not taking volume into account before entering the market can be a mistake, especially on high volatility days, making it more challenging to analyze the asset.

We will compare three different volume-based indicators: On Balance Volume, the Money Flow Index, and the Accumulation/Distribution. Then, we will show you a practical and straightforward way to incorporate them into your repertoire so you can start paying attention to volume.

The Best Forex Robots Report Is Already Here!
best forex robots
Check out 30+ best expert advisors with daily updated live results and statistics
Click Here

On balance volume (OBV). How does it work?

To understand this powerful indicator, let’s look at an example in the graph:

A candle closing below the previous candle in the EURUSD 5-min chart

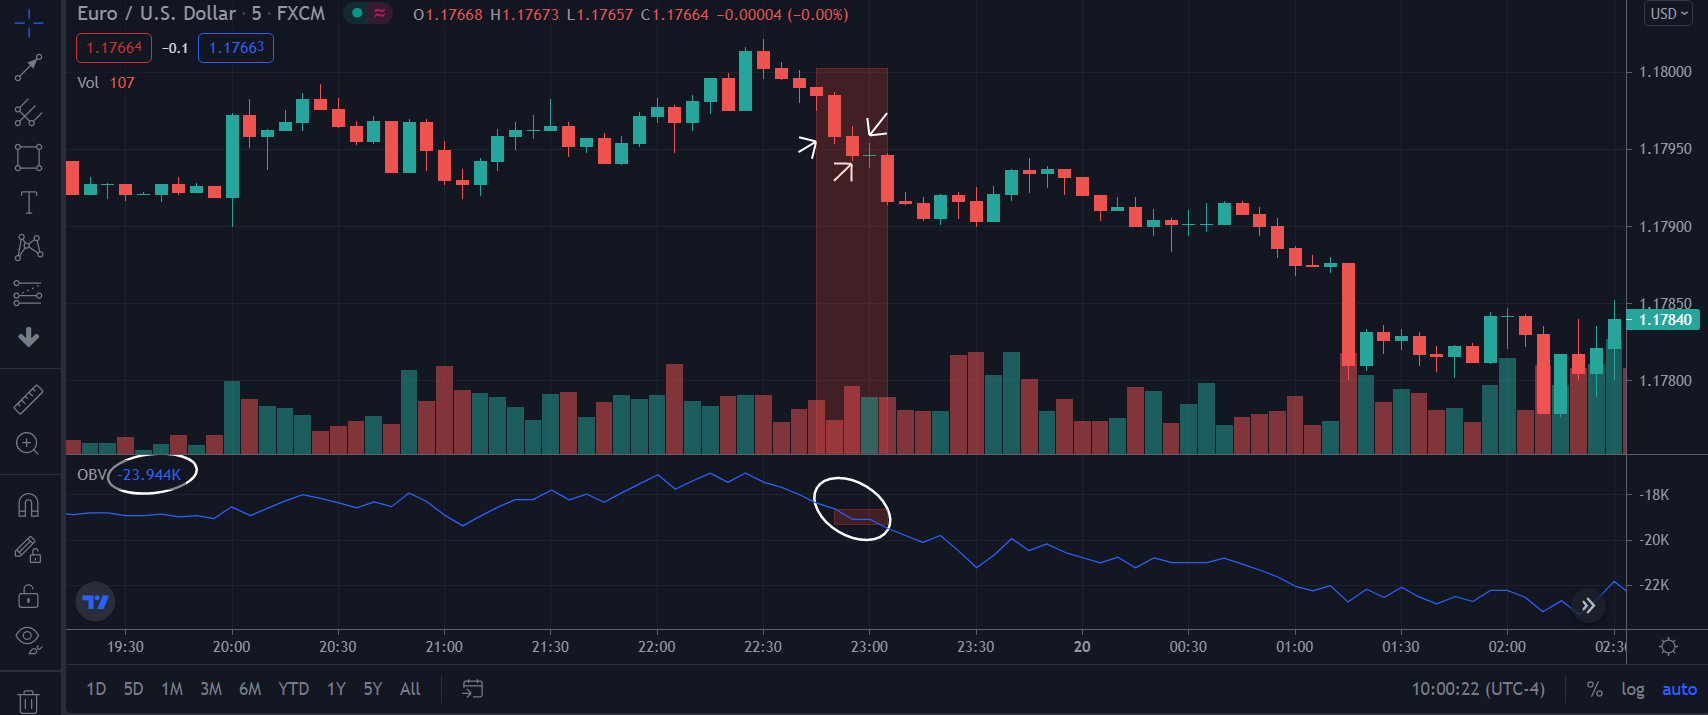
Notice how the second candle selected with an arrow closes below the previous candle. In this case, the indicator takes the volume of the last candle and subtracts it from the previous one, resulting in the OBV slope going down.

Advantages of OBV

If you combine it with other indicators, it will give you more precision in your purchases and sales in the market.

Disadvantages of the OBV

If you look at it on large time frames, you will not find a good entry point because the indicator analyzes the closing of the candlesticks. Therefore, it will move slower.

How to use the OBV in your trading?

Identifying divergences is one of the easiest ways to use this indicator. Let’s see:

The EURUSD 5-min price chart forming a higher high, and OBV forming a lower high.

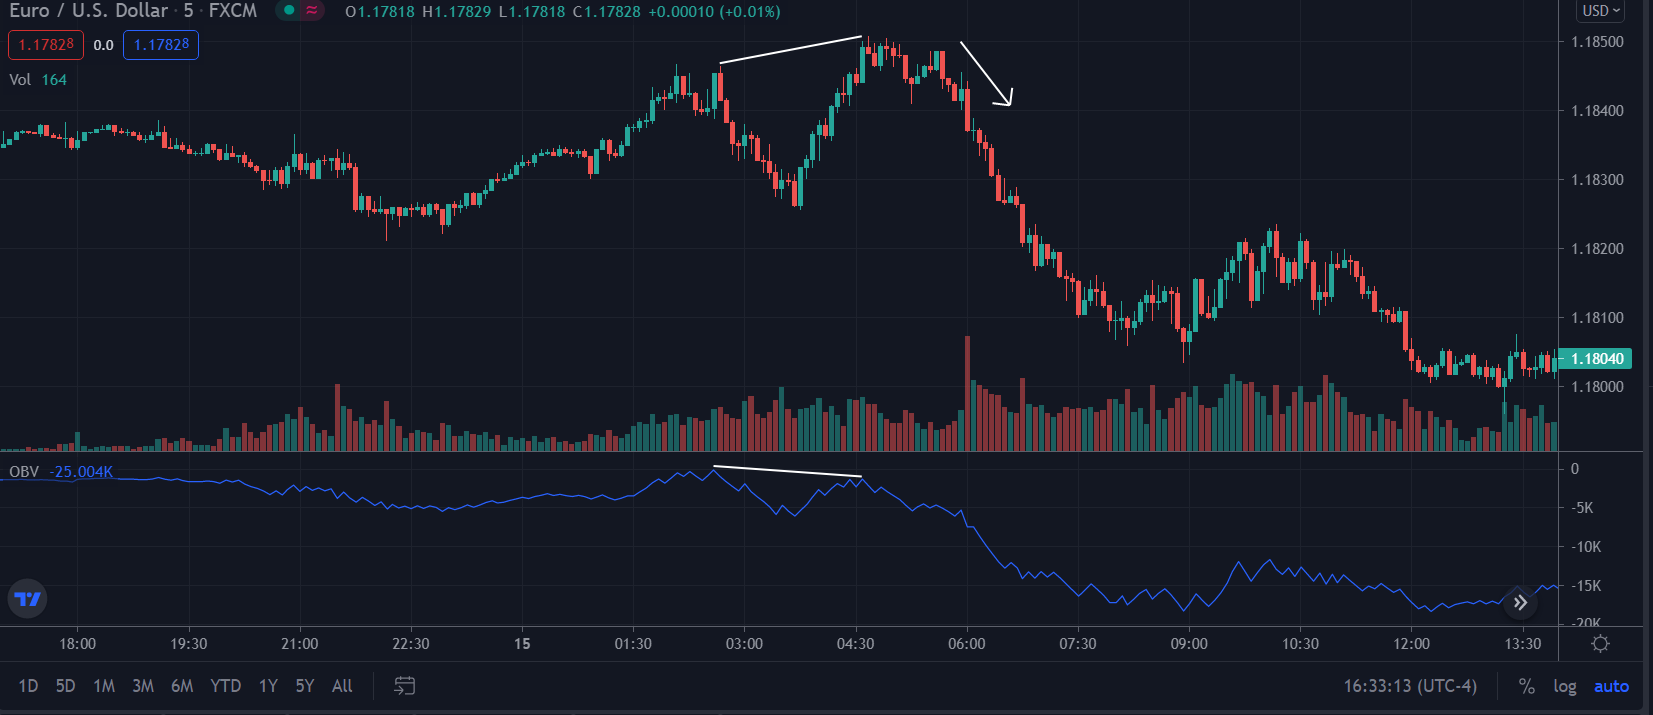
If there is a new high in the price and a new low in the OBV, there was a volume divergence. When this happens, the price usually reverses and produces a change of trend. In the chart above, the EURUSD 5-min price chart peaks between 4:30 and 6:00, forming a higher high, while OBV is forming a lower high.

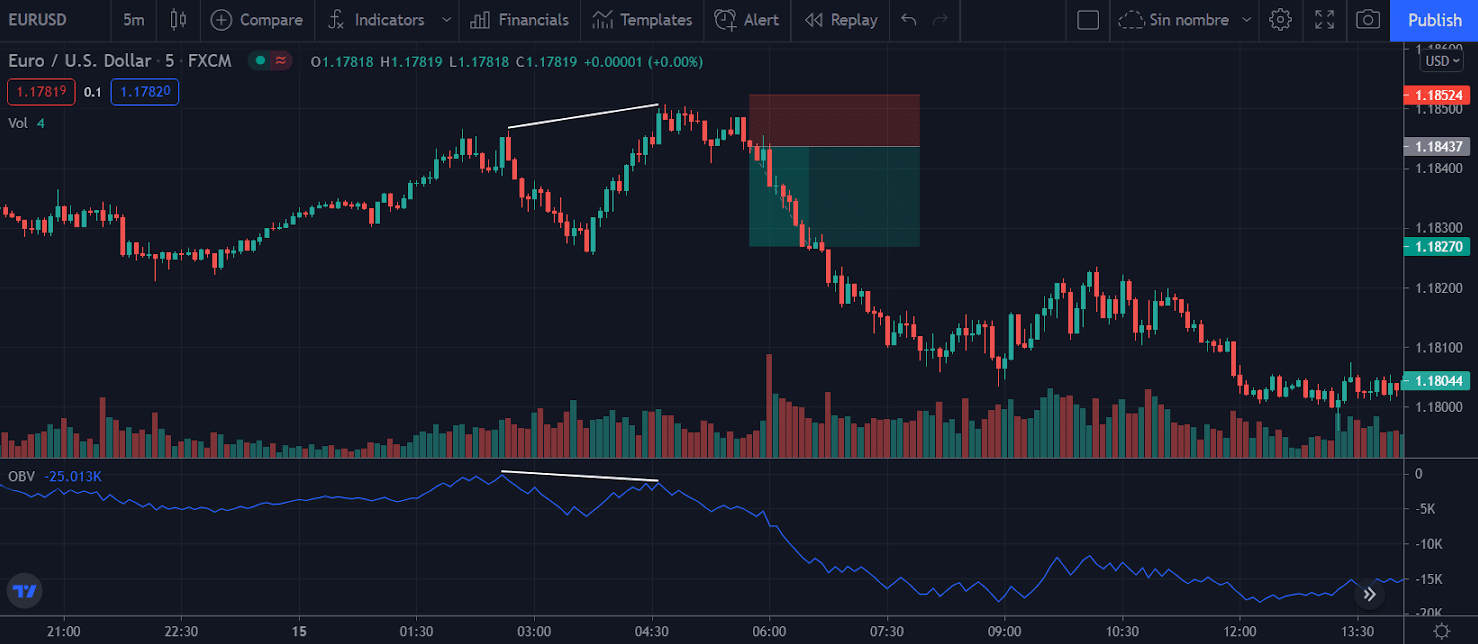
A tip that you can apply is to wait for the price to touch the new high again, and if it cannot overcome it, you take a position in the next candle. 

Place your stop loss just above the previous high, and your take profit can be where you want it to be as, for example, previous support.

Stop loss regions highlighted on the chart

Money Flow Index (MFI). How does it work?

If you are looking for an indicator that examines price and volume, this is the one for you. Knowing as a momentum indicator provides information on the outflow or inflow of money in a given time through an oscillator.

Usually, analysts interpret MFI by overbought or oversold levels, but this is not the best way to use it, as a reversal does not always occur when reaching these levels.

Advantages of MFI

It is better than indicators that use only price and time, such as RSI.

Disadvantages of MFI

Overbought and oversold levels are not always accurate in identifying reversals.

You will need other predictive indicators to improve accuracy on entries.

How to use the MFI in your operations?

To show you a simple strategy with this indicator, you should modify the overbought and oversold levels from 80 to 90 and from 20 to 10, respectively. It is less common for the price to touch these levels, so the possibility of price reversal increases.

MFI settings update

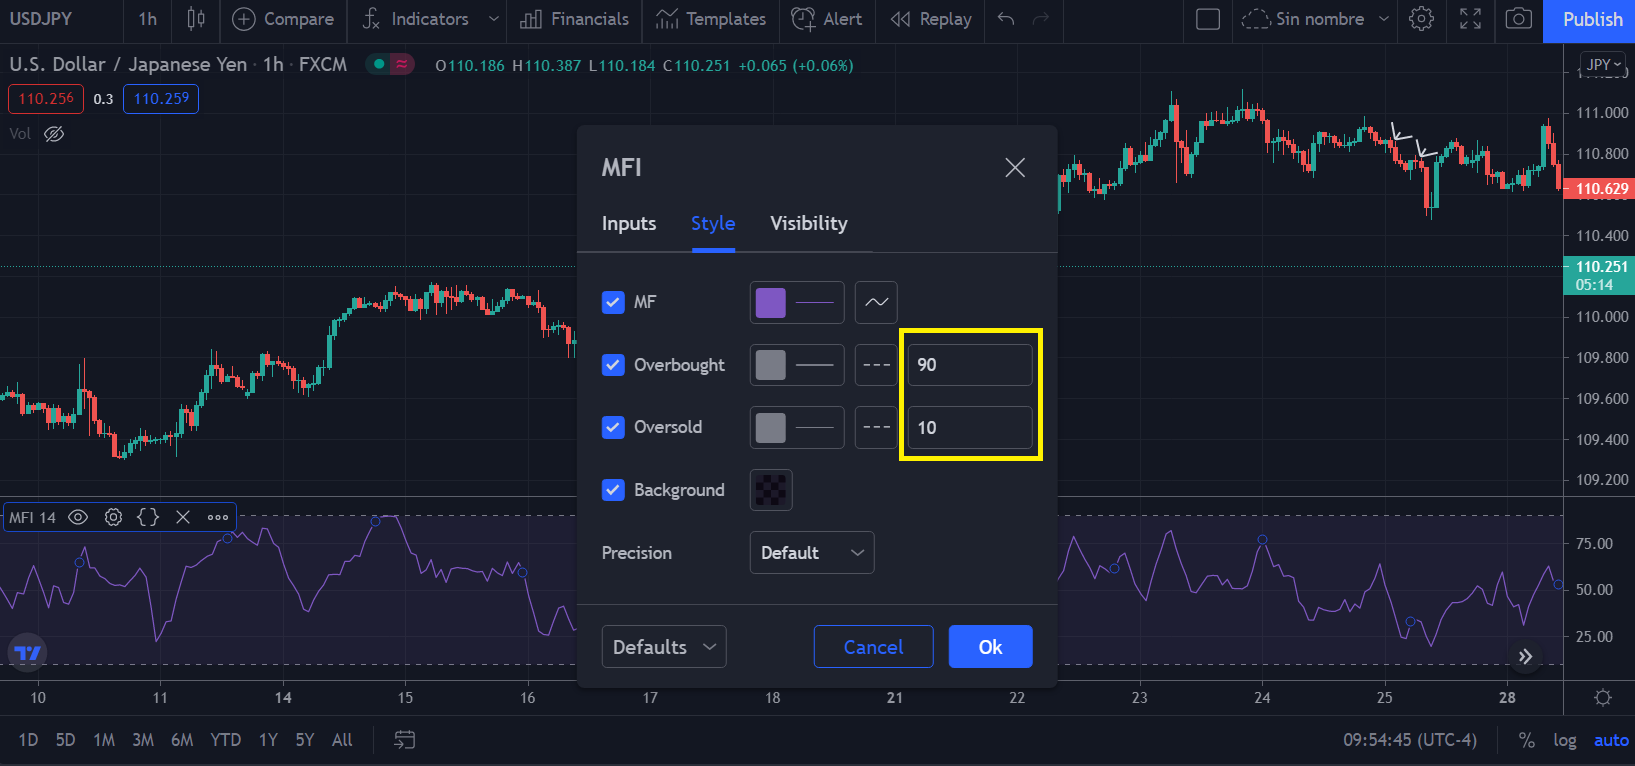
Once set up as recommended, let’s look at an example trade on the GBPUSD pair in a 1-hour time frame.

MFI touching the overbought level on July 4th, 2021

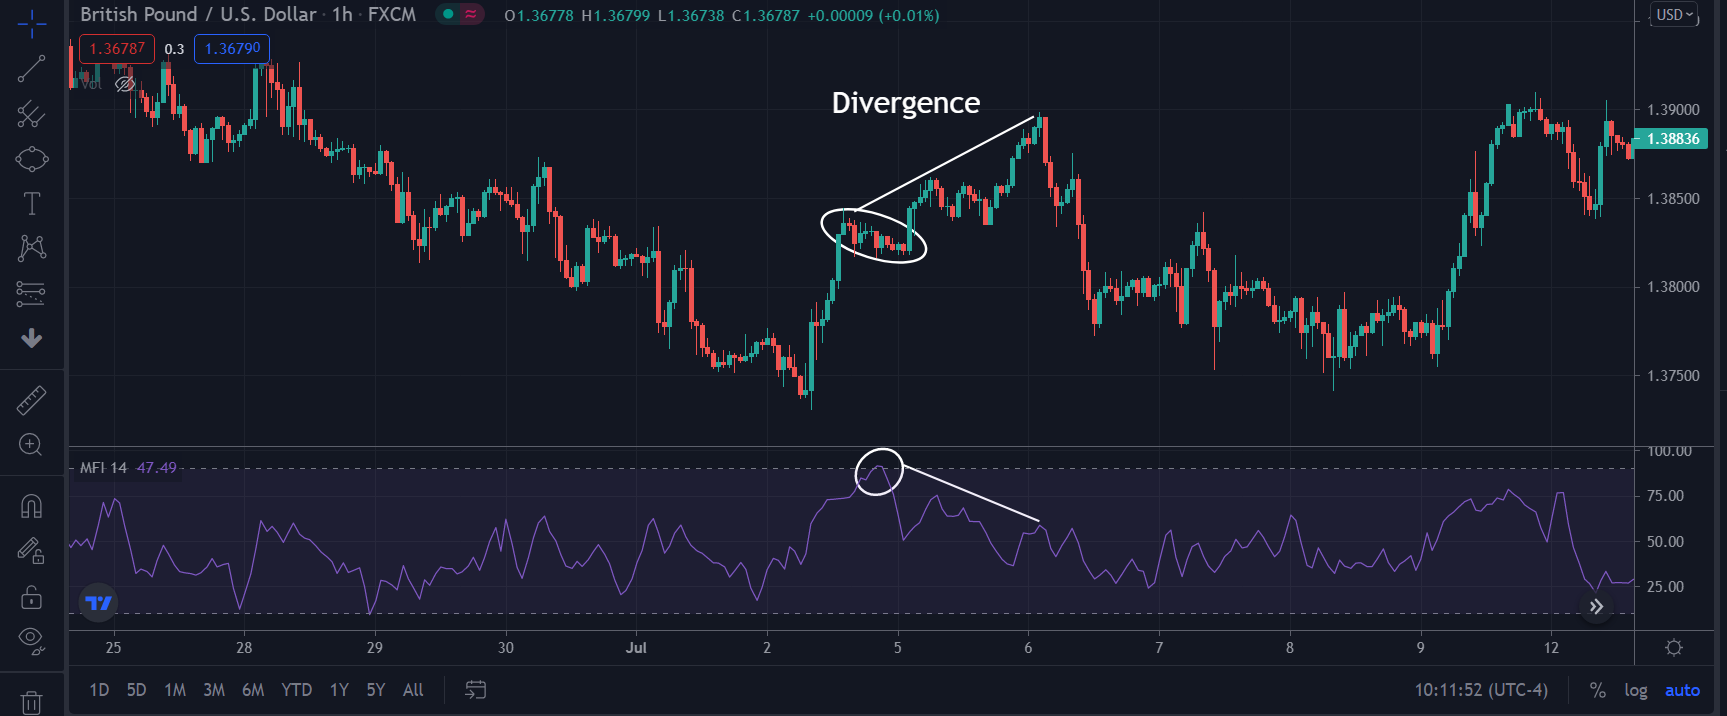
Notice on the chart that MFI touched the overbought level of 90 on July 4th, 2021, but wait, you should not take positions immediately. 

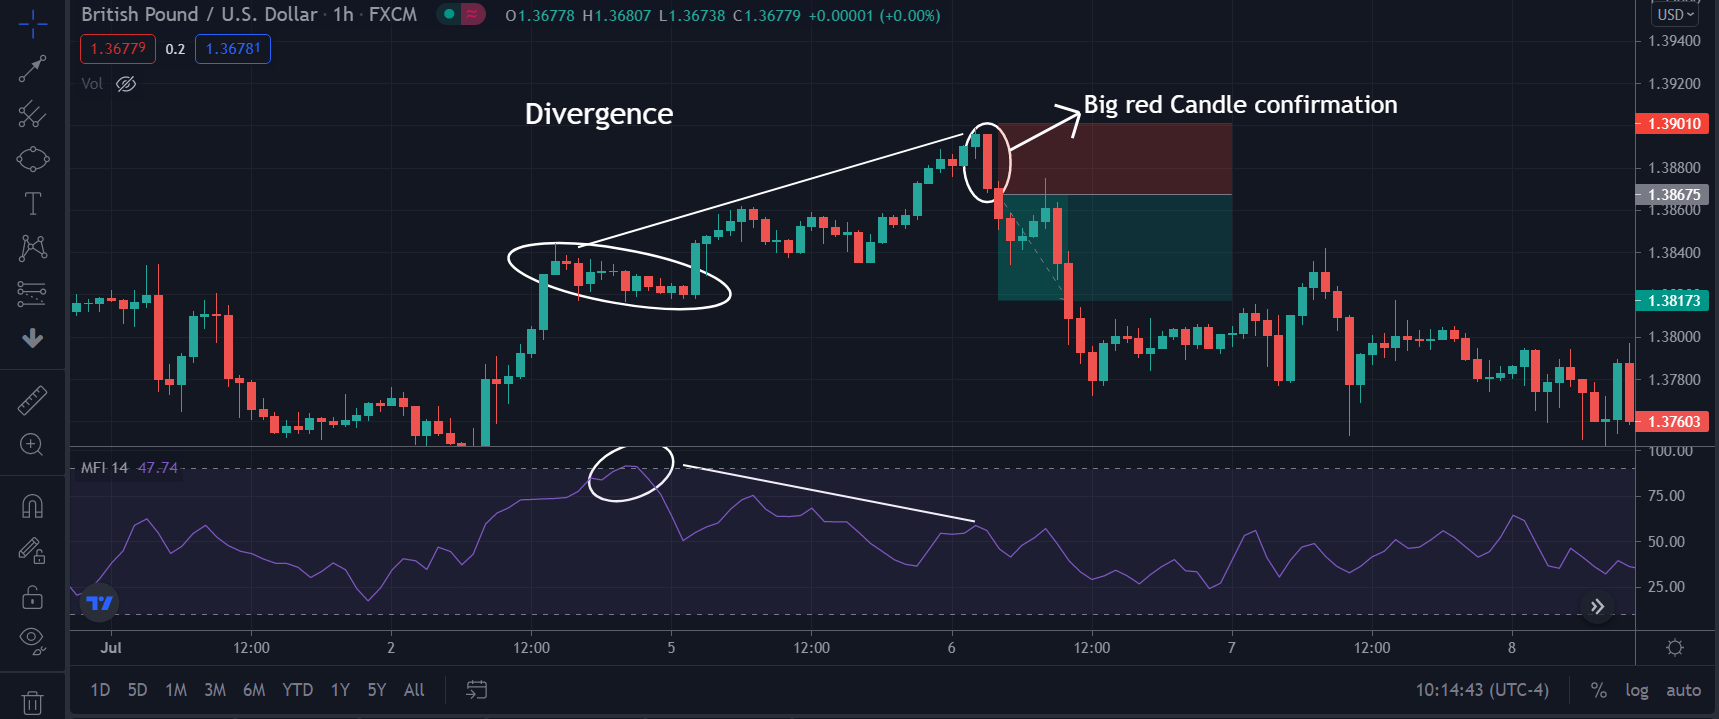
Once it touches the overbought level, you should pay attention to the price action. It would be best to wait for it to make a new high and for the MFI to create a new low. In this way, we will be identifying a divergence correctly.

Although the price made two new highs, the indicator was telling us the opposite, and there was less and less buying pressure.

Waiting for confirmation with a large bearish, or bullish candlestick increases the chances of a successful trade.

Big bearing candle is formed on the price chart after the MFI chart forms a lower low.

Accumulation/Distribution (A/D)

Traders use this indicator to know through price and volume when an asset is being bought or sold in large quantities.

It provides valuable information about market behavior, specifically, what impact supply and demand have on the price. It tells us whether there are more buyers (accumulating) or sellers (distributing).

If we see a rising A/D line, it indicates that the market is in an accumulation phase. Conversely, if the line is falling, it denotes a market in the distribution phase.

With this indicator, we will find two variants:

  • Price rises or falls, and the A/D accompanies it: if we see price goes up or down and A/D accompanies it, we are in a good trend with strength since there is still a flow of purchases or sales.
The EURUSD price reversal not accompanied by A/D
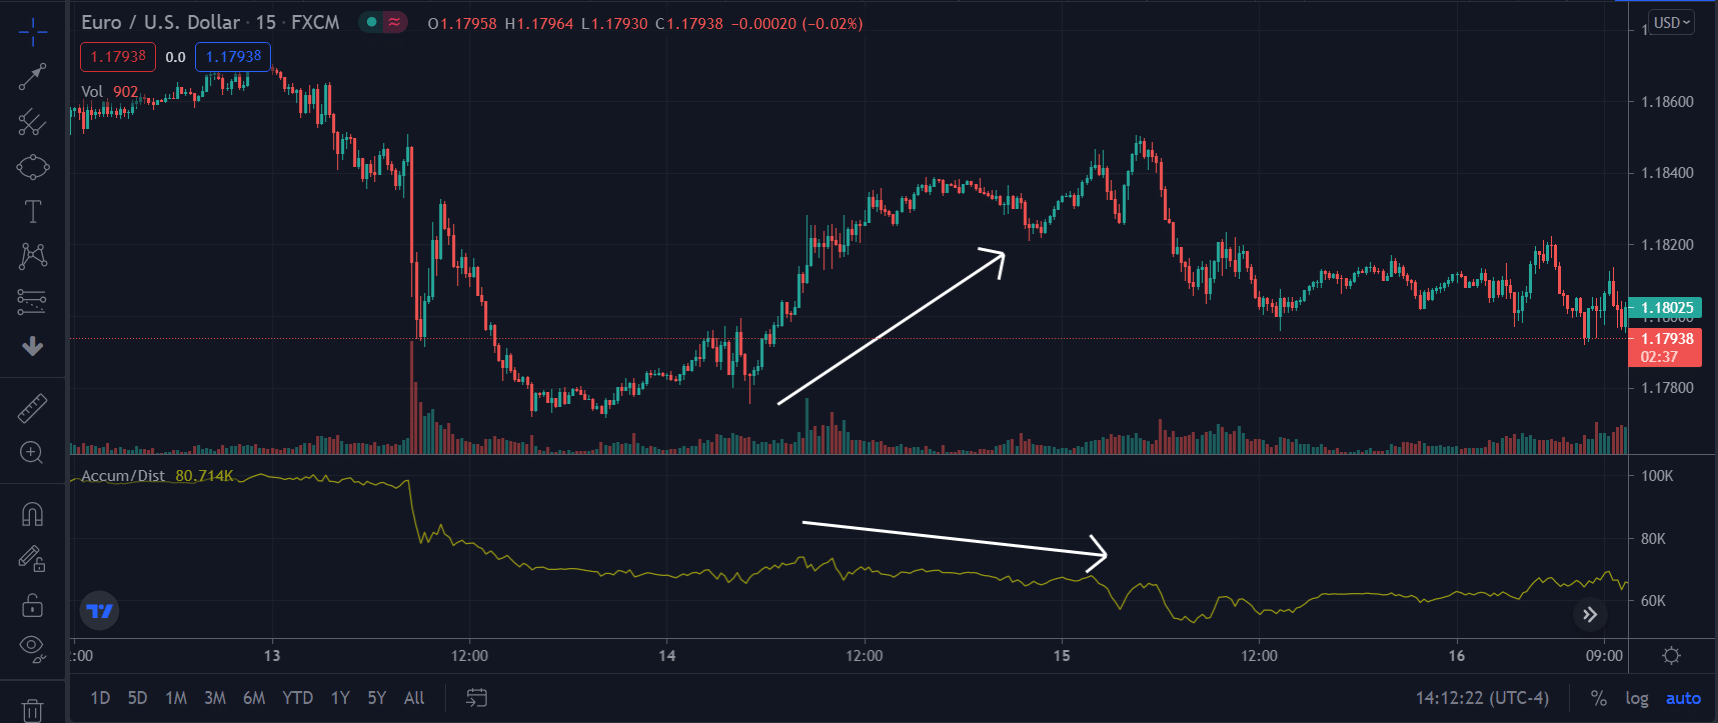
  • Price rises or falls, and the A/D does not accompany it: if we see price goes up or down and A/D doesn’t accompany it, the trend is weakening because the flow of purchases or sales decreases.
The EURUSD price forms new highs, and the A/D indicator goes down

Advantages of A/D

  • It allows us to identify and monitor the flow of large amounts of money into an asset.
  • We can use it on larger time frames to capture movements with higher percentages.

Disadvantages of A/D

  • It does not consider the gaps between the opening and closing price in the stock and Forex markets; this can affect your short-term analysis.
  • It should be used with other types of indicators to improve its accuracy.

How to use A/D in your trading?

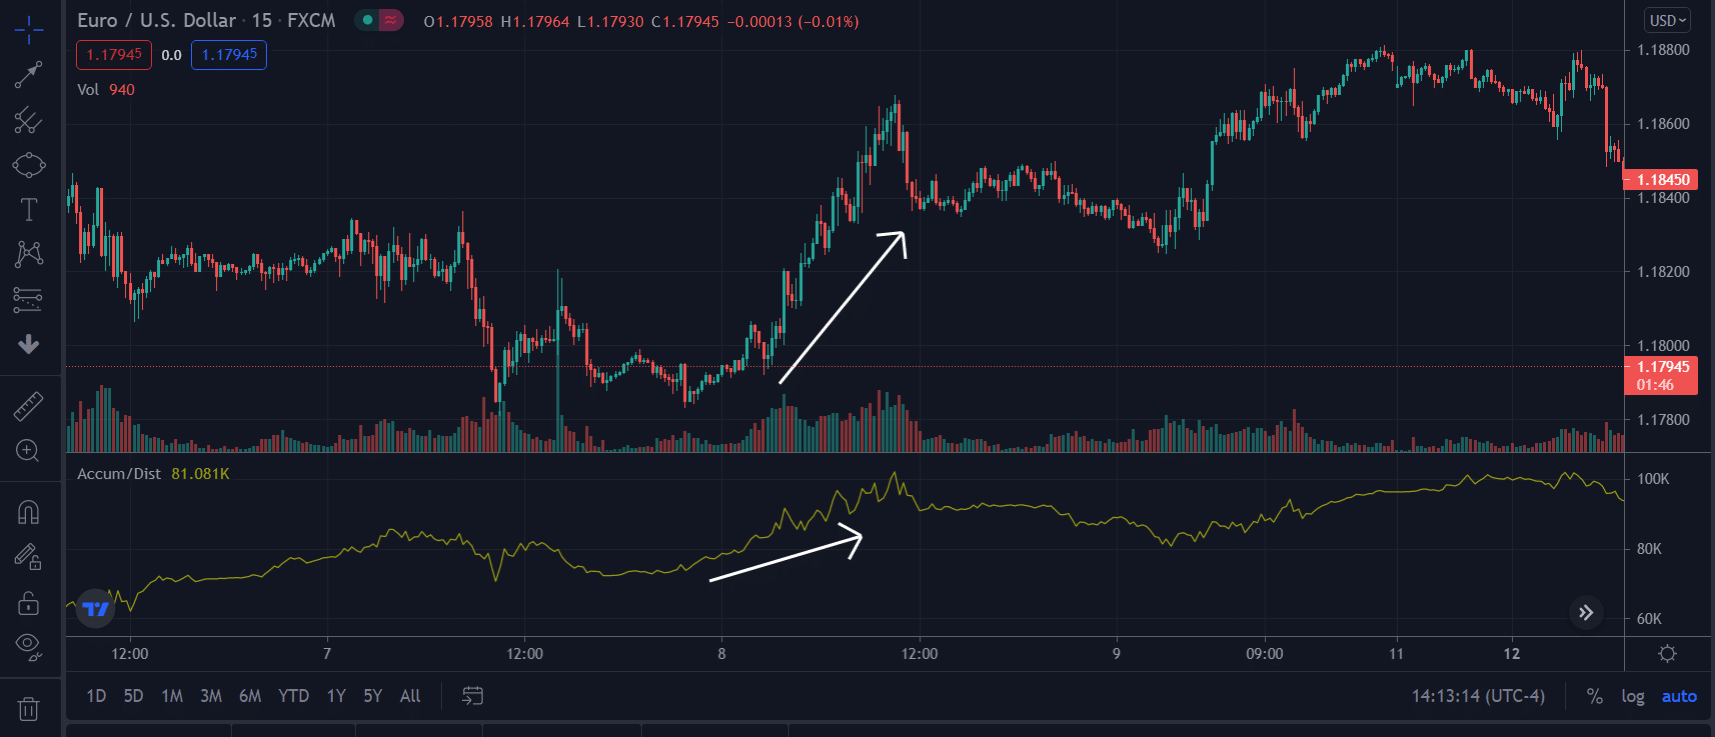
Let’s see an example of how you can use it to enter a trend:

EURUSD chart

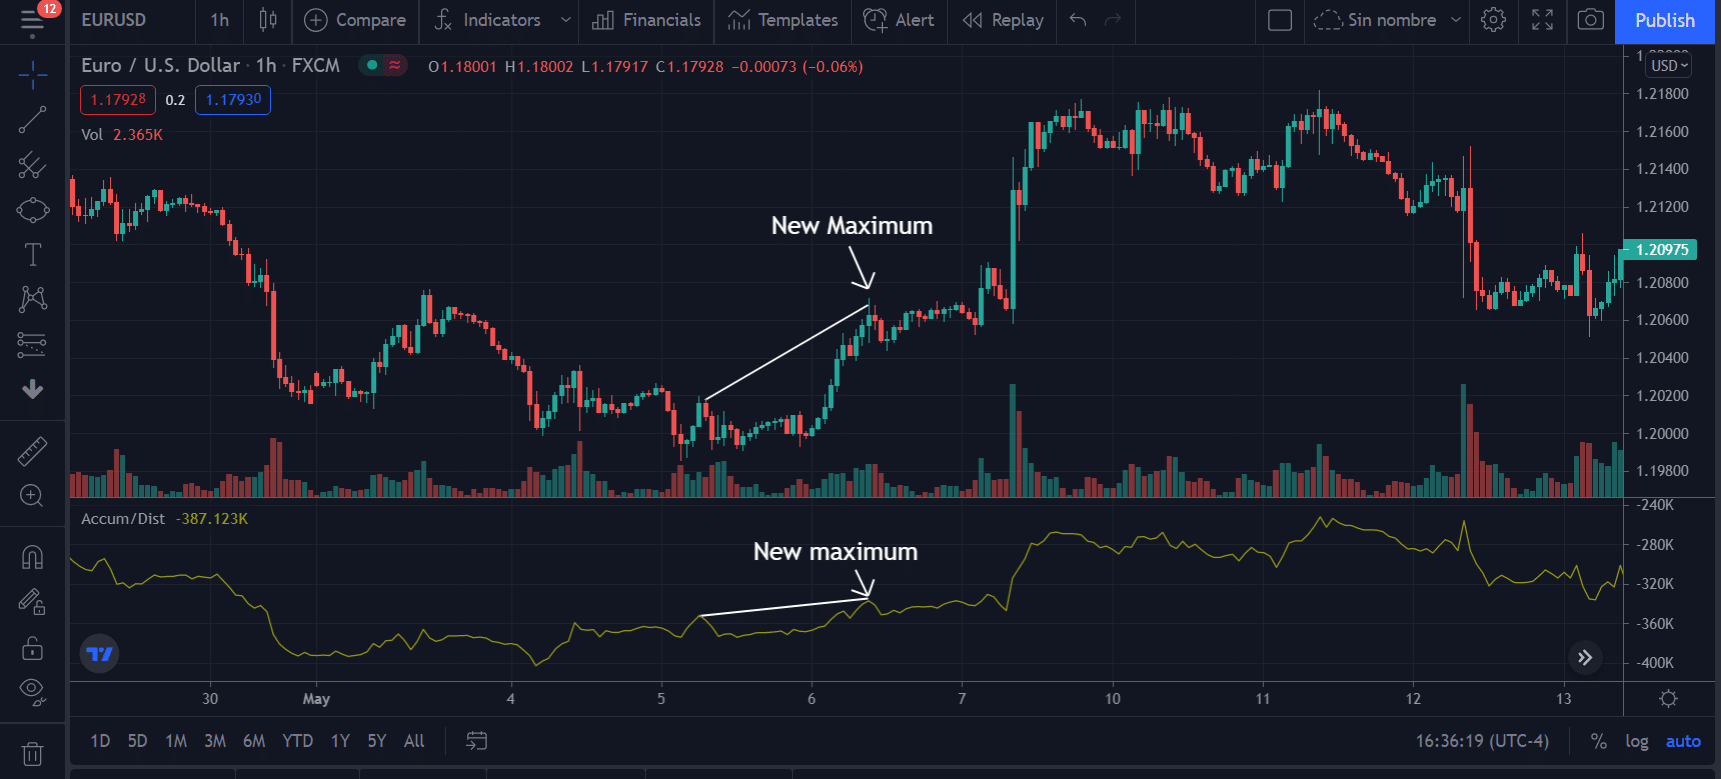
To enter the market in an uptrend, we can confirm if we see the price and indicator making new highs. 

Conclusion

If you want to take your trading experience to the next level, you must take into account everything related to volume.

Learning about the three indicators we have described in this publication has its benefits. You will draw your conclusions and test to see if you should add any to your repertoire.

An expert recommendation is to combine volume indicators with other time indicators. It can make your strategy have a higher percentage of success because you take into account more aspects that affect the price.

In conclusion, none of the indicators that we have broken down is better than any other. So the first thing to do is to backtest each one separately to see which one is more accurate and effective from your point of view.

The Best Forex Robots Report Is Already Here!
best forex robots
Check out 30+ best expert advisors with daily updated live results and statistics
Click Here
ShareTweet
Previous Post

GBPUSD (Cable): Fundamental Analysis Guide

Next Post

Entry Points Pro Review

Related Posts

How to Rip Profits with Custom Indicators on MT4

How to Rip Profits With Custom Indicators on MT4

by Adam Stanley
February 3, 2022
0

Indicators are important tools that day traders and investors use to predict the direction of a financial asset like stocks,...

Technical Indicator Implementation in Forex vs. Crypto: Step by Step Guide

Technical Indicator Implementation in Forex vs. Crypto: Step by Step Guide

by Tim Baudin
January 31, 2022
0

Technical analysis is crucial for anyone looking to gain an edge while trading any market, be it forex, stock, or...

TJ10X Forex Indicator

TJ10X Forex Indicator Review

by Chintan Patel
September 28, 2021
0

TJ10X Forex Indicator is an MT4 tool developed by the SinryAdvice company. It provides signals for multiple currency pairs and...

The Fall Indicator

The Fall Indicator Review

by Adam Stanley
September 27, 2021
0

The Fall indicator provides trading signals for traders and provides desktop and mobile alerts for traders. The algorithm does not...

Pipbreaker

Pipbreaker Review

by Adam Stanley
September 16, 2021
0

Pipbreaker claims to be the best indicator for MT4 and the most efficient way to trade manually. As per vendor...

Load More

Leave a Reply Cancel reply

Your email address will not be published. Required fields are marked *

Best Forex Automated Systems

  • TechBerry 9/10
  • Happy Galaxy 8.5/10
  • Forex Cyborg 8.5/10
  • Forex Fury 8/10
  • FXgoodway 7.5/10
  • Best Forex Brokers
  • Best Forex Robots
  • Best Forex Signals
  • Best Forex Managed Accounts

Top Trading Markets

We are dedicated to demystify the world of forex trading for you – no matter what level you are on.

Categories
  • Automated Trading
  • Crypto Robot Review
  • Cryptocurrency Trading
  • Day Trading
  • Forex Basics
  • Forex Brokers
  • Forex Education
  • Forex Forecasts
  • Forex Indicators
  • Forex Market Commentary
  • Forex Robots
  • Forex Signals
  • Forex Signals
  • Forex Tools
  • Forex Trading Strategies
  • Forex VPS
  • Fundamental Analysis
  • Managed Accounts
  • Money Management
  • News
  • Review
  • Review Platforms
  • Risk Management
  • Social Trading
  • Technical Analysis
  • Top World Traders
  • Trading Apps
  • Trading Psychology
  • Uncategorized
Tags
Acquisition AI Amazon Apple Artificial Intelligence Bitcoin bond yields CEO China earnings earnings report economy Electric Vehicles Federal Reserve financial performance Financial Results forex ea forex software reviews Growth Guidance Housing Market inflation interest rates Investing investment Investors Market Volatility merger mortgage rates net profit Nvidia Oil prices Q2 Results revenue Revenue Growth Sales sales growth Stock Futures stock market stock performance Stocks strategies technology Tesla Video
  • Terms of Use
  • Privacy Policy
  • Compensation Disclosure
  • Risk Disclosure
  • About Us
  • Contact Us

Copyright © 2023 by ForexEzy.com

No Result
View All Result
  • Top Forex Advisors
    • Best Forex Robots
    • Best Forex Signals
    • Best Managed Accounts
  • Top Forex Brokers
    • Best Forex Brokers
    • US Forex Brokers
    • UK Forex Brokers
    • MT4 Forex Brokers
    • MT5 Forex Brokers
    • Zero Spread Brokers
    • Best PayPal Brokers
    • TradingView Brokers
    • Social Trading Platforms
  • Top Review Platforms
  • Forex Education
    • Getting Started
    • Forex Basics
    • Forex Trading Strategies
    • Money Management
    • Risk Management
    • Technical Analysis
    • Fundamental Analysis
    • Trading Psychology
    • Social Trading
    • Automated Trading
  • Forex Tools
    • Forex Robots
    • Forex Indicators
    • Forex Signals
    • Forex VPS
  • Forex Forecast
  • Crypto
    • Best Crypto Exchanges
    • Best Crypto Bots
    • Crypto Guides & Forecasts

© 2023, Forexezy. {copy} {year}