What are the Forex indicators? A vast part of technical analysis is understanding and trading with these tools. Although they are countless, we can broadly define indicators as trend, momentum, volatility, volume, and support and resistance.
It seems there are countless forex indicators, though what exactly do they plan to achieve? For first-time traders learning about technical analysis, indicators are an inevitable part of their journey.
Thousands of traders have mastered a few of these tools and produced consistently profitable results over time. This article will look at 5 of the broad categories indicators fall into, and some of the popular indicators within each group.
What is an indicator?
An indicator merely comprises a neat tool reflecting input mathematical calculations in plotted lines, considering specific aspects of market dynamics, mainly the trend, volatility, momentum, and volume.
Indicators are often the first introduction to new traders when thinking of technical analysis. The use of these tools in trading has its history as far back as the early 1900s (in some cases) in the stock market.
Leading vs. lagging indicators
It’s imperative for traders to thoroughly study an indicator and find an edge or advantageous attributes. There is a consensus that indicators are either lagging or leading. A lagging indicator produces a signal after a market has moved, while a leading indicator does the opposite.
Most technical indicators are technically lagging, while those analysts who consider leading include Fibonacci retracements, support & resistance, etc.
Although traders often discuss such a distinction, no technical indicator (even so-called leading indicators) can necessarily provide a highly accurate signal before the market moves with it due to the probabilistic and chaotic nature of the markets.
Trend indicators
It is only natural to start with trend indicators. The trend is often one of the first considerations, which is confirmed by many studies and observations based on technical analysis. One of the most widely-used quotes in any financial market is, ‘the trend is your friend.’ We define the trend as the tendency for an instrument to move in an identifiable direction over a specific time horizon.
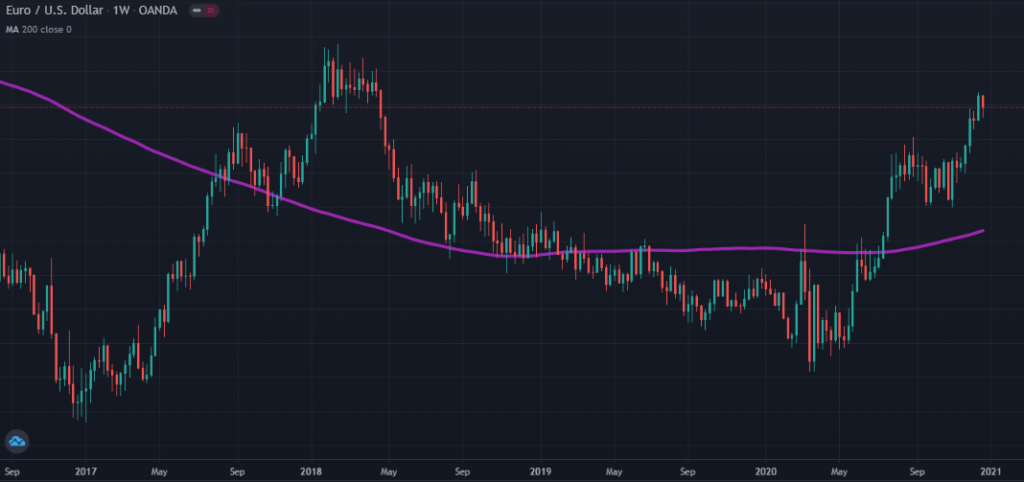
Moving averages
A prevalent indicator, the MA (moving average), is a simple ‘moving’ line based on an average calculation of a set of prices (typically the high, low, open, and close) over a specific period.
Moving averages form the basis of many other indicators, befitting its popularity. This indicator dates as far back as 1901, and no analyst has conclusively credited its creation to one individual.
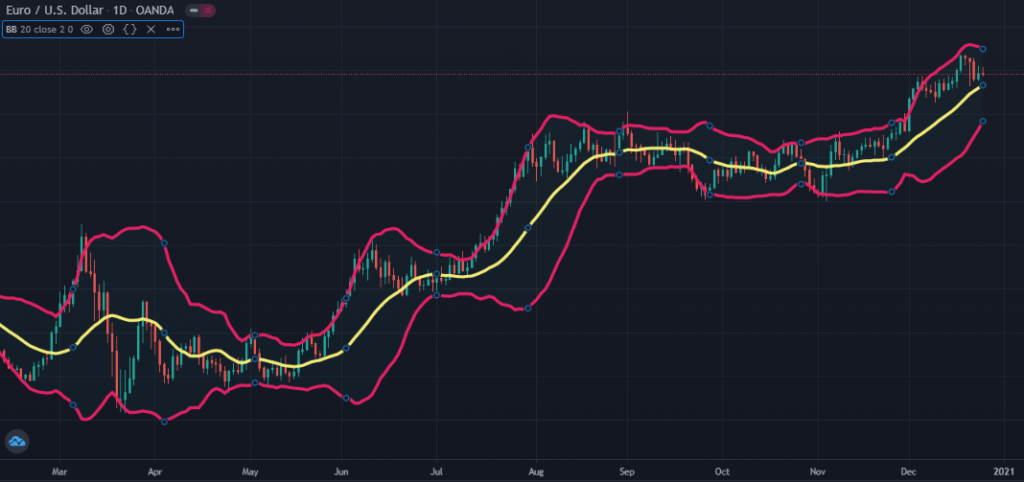
Bollinger Bands
Bollinger Bands are a trend and volatility indicator developed by American financial analyst John Bollinger. Bollinger Bands consist of three lines or bands, which are modifiable moving averages meant to provide a dynamic trend channel.
Momentum indicators (oscillators)
While trend indicators aim to show traders what the overall market direction is, oscillators aim to reflect momentum mainly through ‘overbought’ and ‘oversold’ conditions.
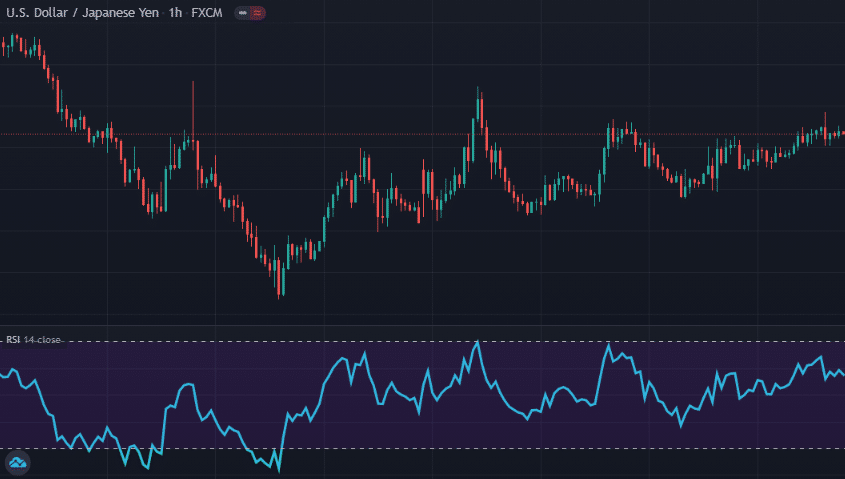
Relative Strength Index (RSI)
RSI is one of the most popular oscillators in many financial markets. Developed by American mechanical engineer turned technical analyst J. Welles Welder, the objective of this momentum indicator is measuring the volatility of a defined set of prices in a market on a line graph moving between two extremes.
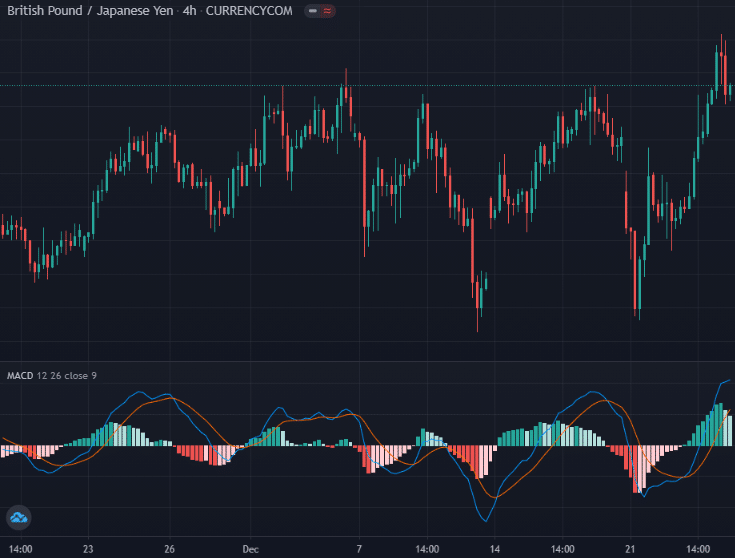
Moving Average Convergence Divergence (MACD)
The MACD is one of the more dynamic indicators as traders use it both for trend-following and momentum. As part of its name suggests, the MACD observes the relationship between two moving averages (a fast and slow MA).
The resulting MACD line is a subtraction of these two moving averages. American financial analyst, Gerald Appel, created this indicator.
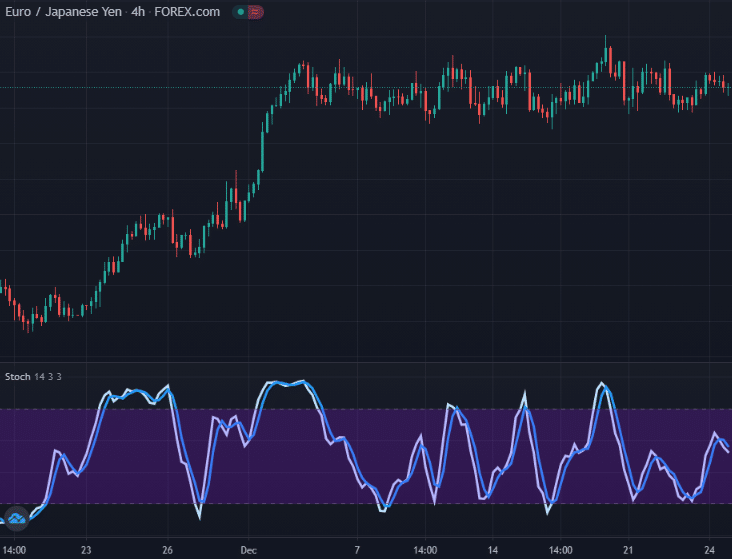
Stochastics
Stochastics or the stochastic oscillator attempts to forecast turning points in a market by looking at the closing price in relation to its range over an adjustable period. The late American securities trader, George Lane, created this indicator.
Volatility indicators
The extent to how drastically and frequently prices of a market fluctuate is known as volatility. Every instrument will have an average range over a defined time. Should it deviate substantially above this point, we consider it as highly volatile – vice versa for when it goes below (low volatility).
Unlike trend and momentum indicators that primarily deal with picking a market’s direction, volatility indicators are more statistical and non-directional.
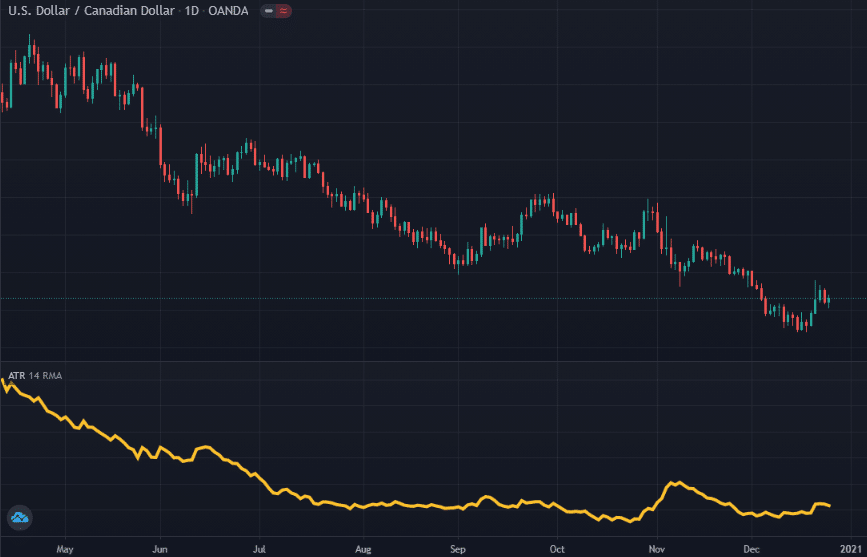
Average True Range (ATR)
The ATR is yet another invention of the legendary American market technician, J. Welles Welder. This technical indicator’s main job is reflecting the number of pips a market has moved in a time-frame by considering its true range over a specific time (typically 14 days, although modifiable).
Volume indicators
Volume in forex technically refers to the number of contracts changing hands between traders of a market over a particular time-frame. Volume is one of the market qualities that’s hard to quantify in forex since this is a decentralized market, meaning no centralized order flow numbers exist.
Hence, volume indicators lag heavier than other tools, resulting in traders using volumes more for confirmation than primary signals for trend direction. A few brokers provide the order flow of their client’s orders, also known as level 2 market depth.
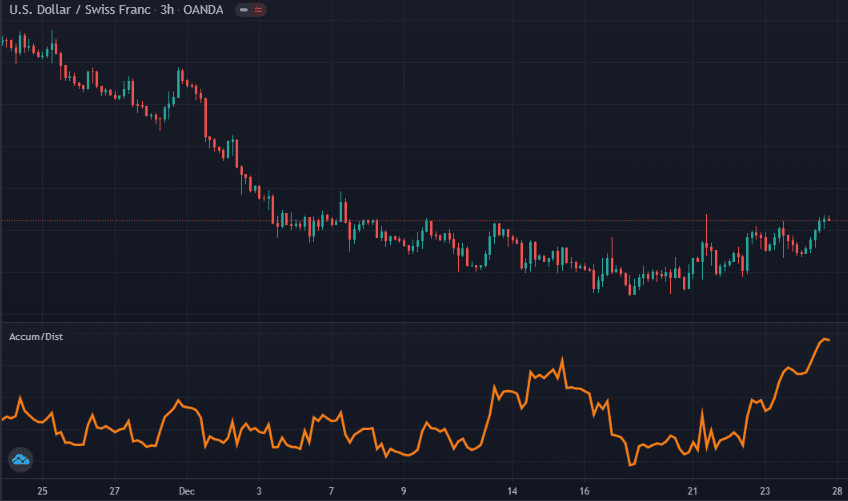
Accumulation/distribution (A/D)
The A/D is known as a cumulative indicator utilizing volume to reflect if an instrument is ‘accumulating’ or ‘distributing.’
In other words, this indicator attempts to reflect how strong a trend is by reflecting whether a market is accumulating more volume or not. Marc Chaikin, an American stock analyst, and entrepreneur developed this tool.
Support and resistance indicators
The concept of support and resistance is probably the first one new traders engage with. Support and resistance refer to the idea of market tops and bottoms.
In a downtrend, support is a price level a market fails to break through, causing an upward retracement. In an uptrend, resistance is the price level a market fails to break through, causing a downward retracement.
Unlike the previous indicators relying on automated mathematical formulas, support and resistance tend to be even more subjective as it relies mostly on an individual’s charting prowess. Thus, they are not necessarily programmed technical indicators.

Fibonacci retracements
Fibonacci retracements are a highly intricate technical tool based on the Fibonacci sequence. The common levels are 23.6%, 38.2%, 50%, 61.8%, and 78.6%, with further extensions above 100% typically used by Elliott Wave traders.
Conclusion
As we can see above, the job of a technical trader is certainly not an easy one since there are many elements to consider. Analysts will typically look at two or three aspects by using, for example, a separate trend, momentum, and volatility indicator.
Others may prefer to perhaps solely use a trend or momentum indicator as to their primary tools. The possibilities are endless, though the common thread is always that a trading decision should be highly calculated and risk-conscious.


