
Overview
There is a recurring belief in trading communities that price lies, but momentum doesn’t. The forex market is somewhat akin to the movements of a train. Like a train, the velocity of any market picks up gradually and peaks in acceleration before stopping.
Momentum in forex attempts to figure out these points of acceleration and deceleration mostly through indicators and price action.
This article will define momentum in its simplest form, some of the common concepts associated with it, why it’s so crucial, and a breakdown of a few popular indicators in this realm.
Defining momentum and why it’s important
Momentum refers to the velocity of price movements in a market, which traders gauge to establish how strong a trend is over a particular period and to understand the buying and selling pressure.
Momentum is an essential technical concept. Analysts believe that in areas of high momentum, this signals an influx of keen traders. For example, in an uptrend with high momentum, a prudent trader should know not to consider buying then, for it would be an expensive place and that selling is going against the trend.
Instead, they may rather wait for a pullback to areas of value to go long where momentum has decreased. While we consider the trend as the direction that price tends to go (up or down), momentum tells us its strength depending on the chosen time-frame.
The other part of momentum is that when prices are peaking, the trend may wane before reversing to a small or large extent. Therefore, understanding momentum can help us anticipate the likelihood of both events happening where we will act accordingly.
Overbought/oversold and divergence
Nearly all momentum indicators are technically oscillators, which are line graphs that ‘oscillate’ between two extremes. The two distinct features of oscillators are overbought/oversold and divergence, which are favorites in trading communities.
While there is no consensus over what the best momentum indicator is, traders are attracted to them mainly for one or both of these qualities.
Overbought and oversold
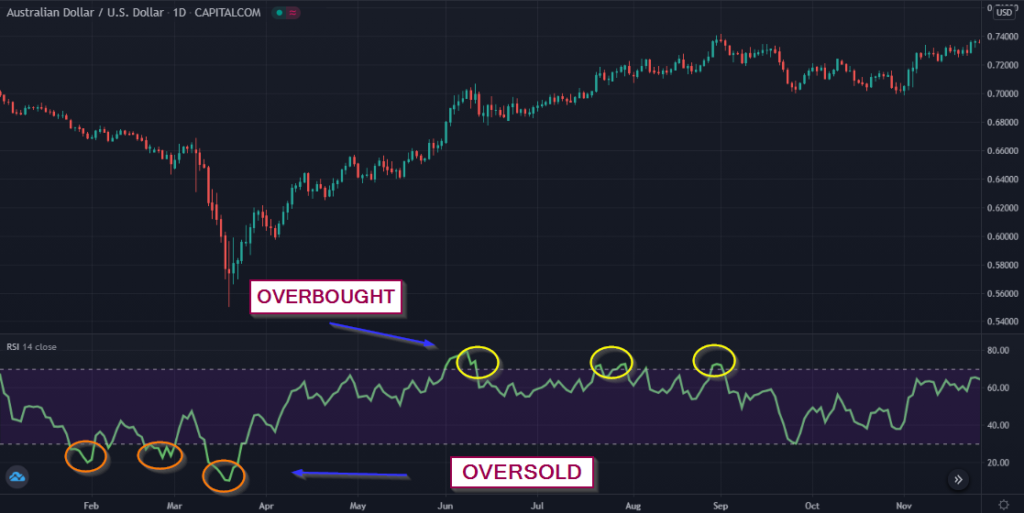
One of the mainstay attributes of oscillators is ‘overbought’ and ‘oversold.’ Most beginners will have heard about these terms, although we should tread with caution its conventional knowledge.
The technical definition of both terms is when prices are exceedingly high (‘overbought’) or low (‘oversold’) above specific extremes on an indicator (as in the image above), at which point traders expect a correction that may lead to a reversal.
Inexperienced traders may use these conditions to ‘pick tops and bottoms,’ a practice that is rarely successful in the long run, especially in strong trends. The natural inclination may be to believe, in a bull market, prices cannot possibly go any higher and should eventually go down.
However, this type of thinking does not mirror reality when we consider the trend, and that markets ebb and flow or move in a step-like motion rather than straightly. The more sensible and conservative approach is to consider an overbought/oversold market to signal a strong bull/bear market.
Skilled and more experienced traders can exploit these conditions to locate areas where sustained reversals can occur, though beginners should be more risk-conscious until acquiring years of experience.
Divergence
Another staple of oscillators is divergence, a discrepancy between the highs and lows of the actual price against those seen on the indicator. Naturally, the oscillator will move in a manner appearing to trace the price movements.
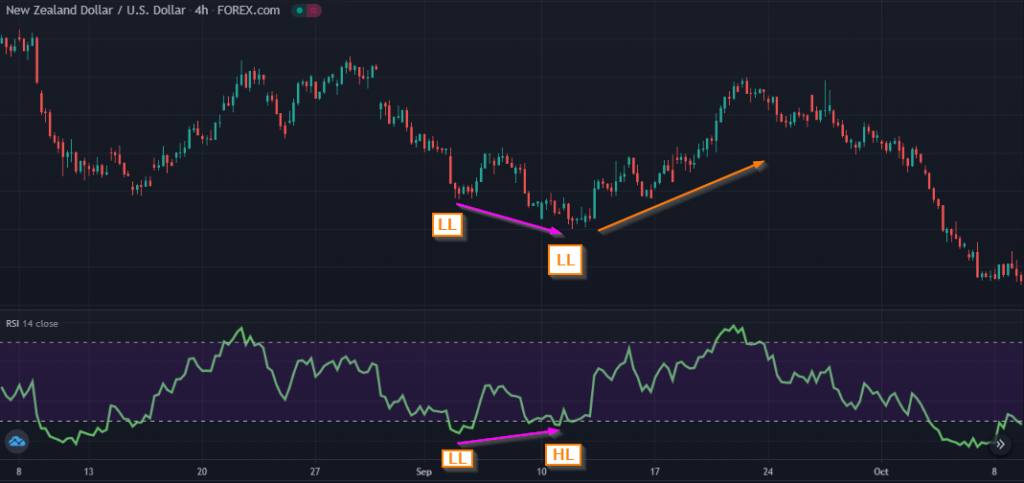
In a downtrend, we characterize the market as continually making lower lows (LL). A bullish divergence then would occur when the oscillator reflects a lower low and a higher low (HL) (see above).
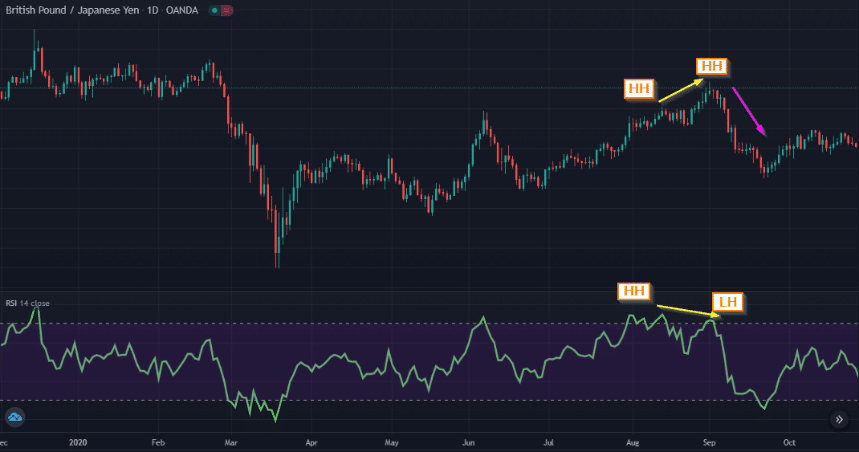
In an uptrend, we characterize the market as continually making higher highs (HH). A bearish divergence then would occur when the oscillator reflects a higher high and a lower high (LH) (see above).
Divergences, combined with other solid confirmations, can be a powerful indicator of a reversal, although they do apply for trend continuation as well.
Most popular momentum indicators
Though there are seemingly countless momentum indicators, traders tend to stick to a handful of tried-and-tested ones for familiarity reasons.
Relative Strength Index (RSI)
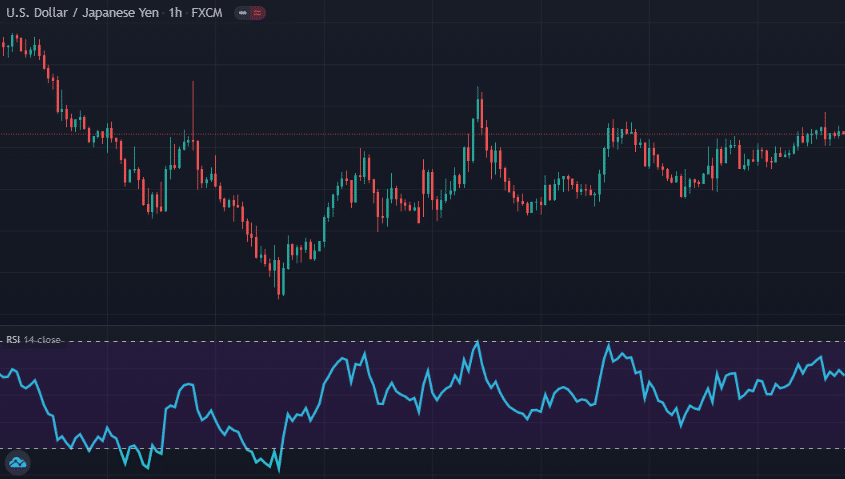
The RSI is exceedingly well-known, not just with oscillators but indicators overall. An invention of legendary technical analyst J Welles Wilder Jr, the RSI is an oscillator depicting an adjustable 14-day moving average moving between 0 and 100 extremes.
We consider readings below 30 as ‘oversold’ and those above 70 as ‘overbought.’ The RSI is a classic, bread-and-butter oscillator as it performs on the two simple principles of overbought/oversold and divergence as referenced previously.
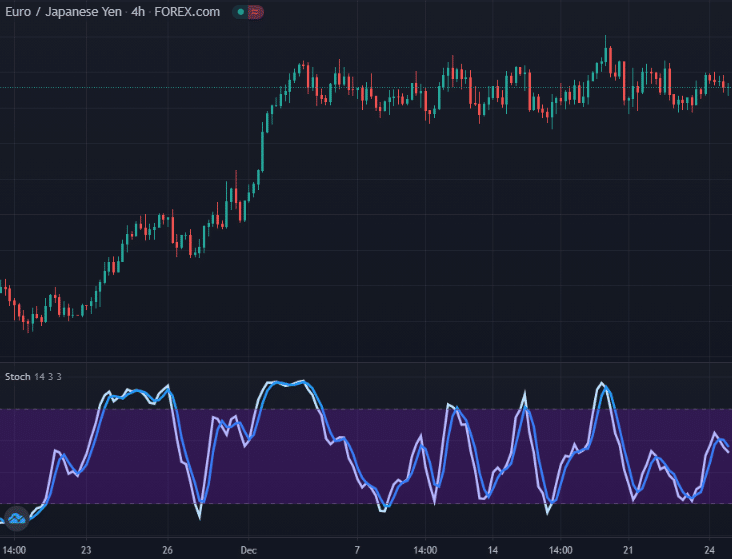
Stochastics
The stochastics indicator works in a similar vein to the RSI and is the older of the two by about two decades. It saw adoption from the late 50s, with the late George Lane, an American securities trader, mostly credited for its invention.
The first resemblance to the RSI is stochastics, as it also moves between 0 and 100 extremes. Traders consider readings above 80 as overbought, while those below 20 as oversold. However, instead of one moving average, stochastics utilizes two moving averages known as the %K and %D lines (one fast and one slow).
Like moving average crossovers, one method traders take advantage of with this indicator is looking for moments when both lines cross after the market moves away from the 80 or 20 areas. Stochastics are also capable of presenting divergence opportunities.
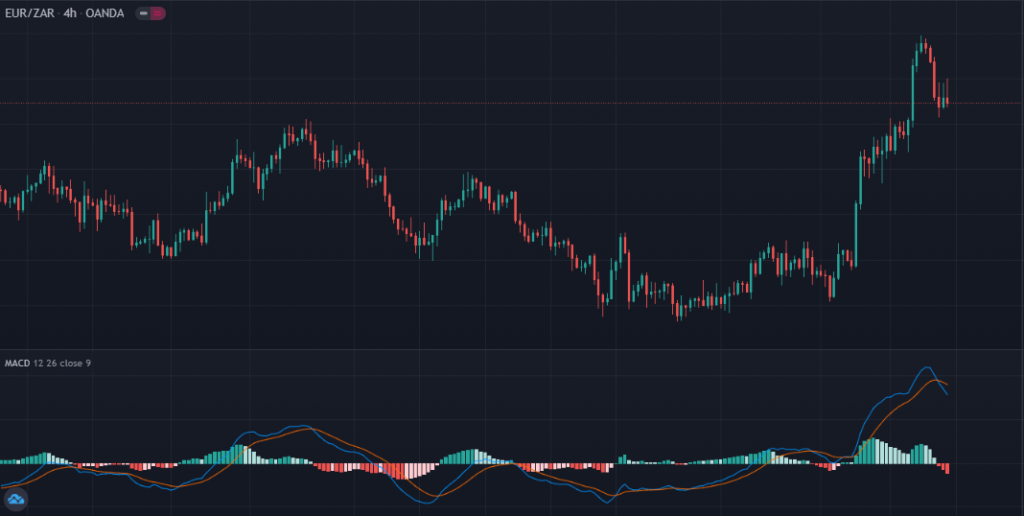
Moving average convergence divergence (MACD)
Traders consider the MACD to act as both a trend and momentum indicator. It was invented in the late 70s by American professional money manager, Gerald Appel, sharing a few core components of both stochastics and the RSI.
Composition-wise, the MACD aims to reflect the relationship between two adjustable exponential moving averages (EMAs) of 26 days (slow) and 12 days (fast) on a histogram. The subtraction result of these two moving averages produces the MACD line.
Furthermore, the signal line, an adjustable 9-day moving average, goes along with the MACD line. Traders utilize crossover methods based on both the MACD and signal lines. One can also read momentum and divergence using the histogram bars.
Conclusion
When entering a trade, the goal is to enter at points of low momentum. Even if one has thought to trade according to the correct trend, a lack of momentum understanding could mean a late entry when the market may be in a correction phase.
After the trend, many analysts believe momentum to be the second most important technical element. Although the trend simply deals with the direction of the market, momentum shows how powerful that movement is. As with any specialized tool, traders should not use these indicators in isolation.


